Usage
Monitor and analyze your AI platform usage across deployments, routers, and request history. This comprehensive billing dashboard provides detailed insights into resource consumption, performance metrics, and cost optimization opportunities.
Self-Deployed Models Usage
The Deployments section provides comprehensive monitoring and billing information for your AI model deployments.
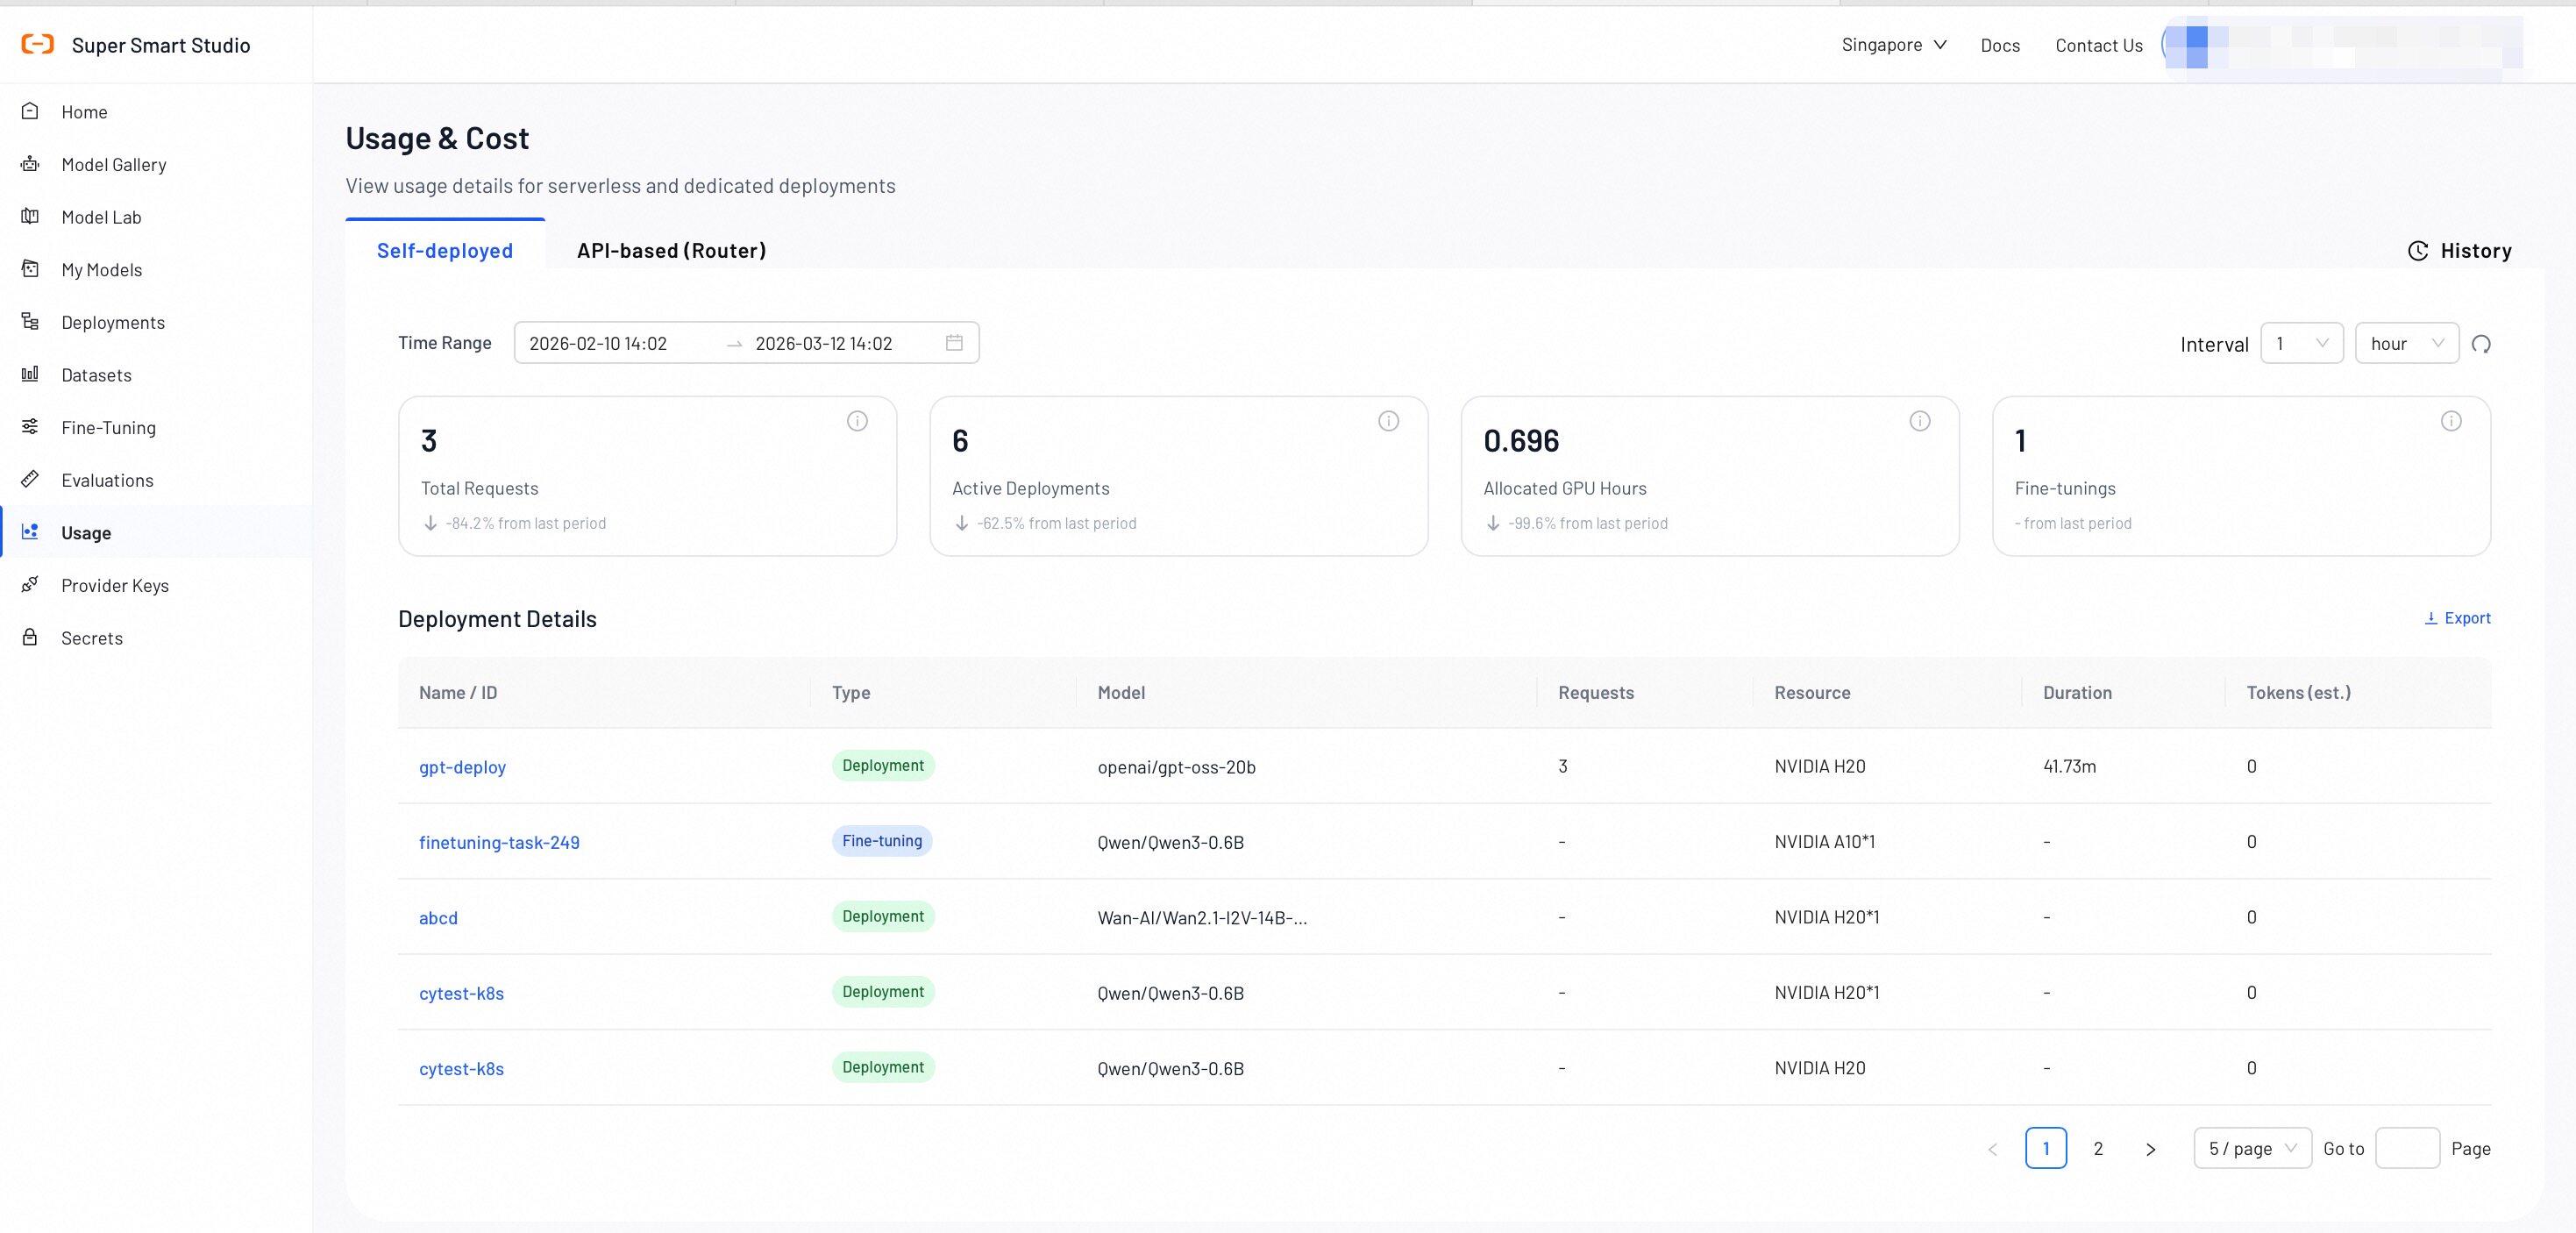
Key Metrics Overview
- Total Requests: The cumulative number of API requests made to all your deployments within the selected time range.
- Active Deployments: The current number of running deployments across your account.
- Allocated GPU Hours: The total GPU compute hours allocated to your deployments.
- Fine-Tunings: The number of fine-tuning operations that are completed or in progress.
Deployment Details Table
| Name | Description |
|---|---|
| Name | A unique identifier for each deployment. |
| Type | The category of the deployment: Deployment, Fine-Tuning. |
| Model | The specific AI model being deployed. |
| Requests | The total number of API calls processed by the deployment during the selected time period. |
| Duration | The total runtime of the deployment, displayed in hours and minutes. |
| Tokens (est.) | The estimated total number of tokens consumed by the deployed models. |
API-Based Models Usage (Router)
The Routers section provides insights into serverless AI model usage and routing performance.
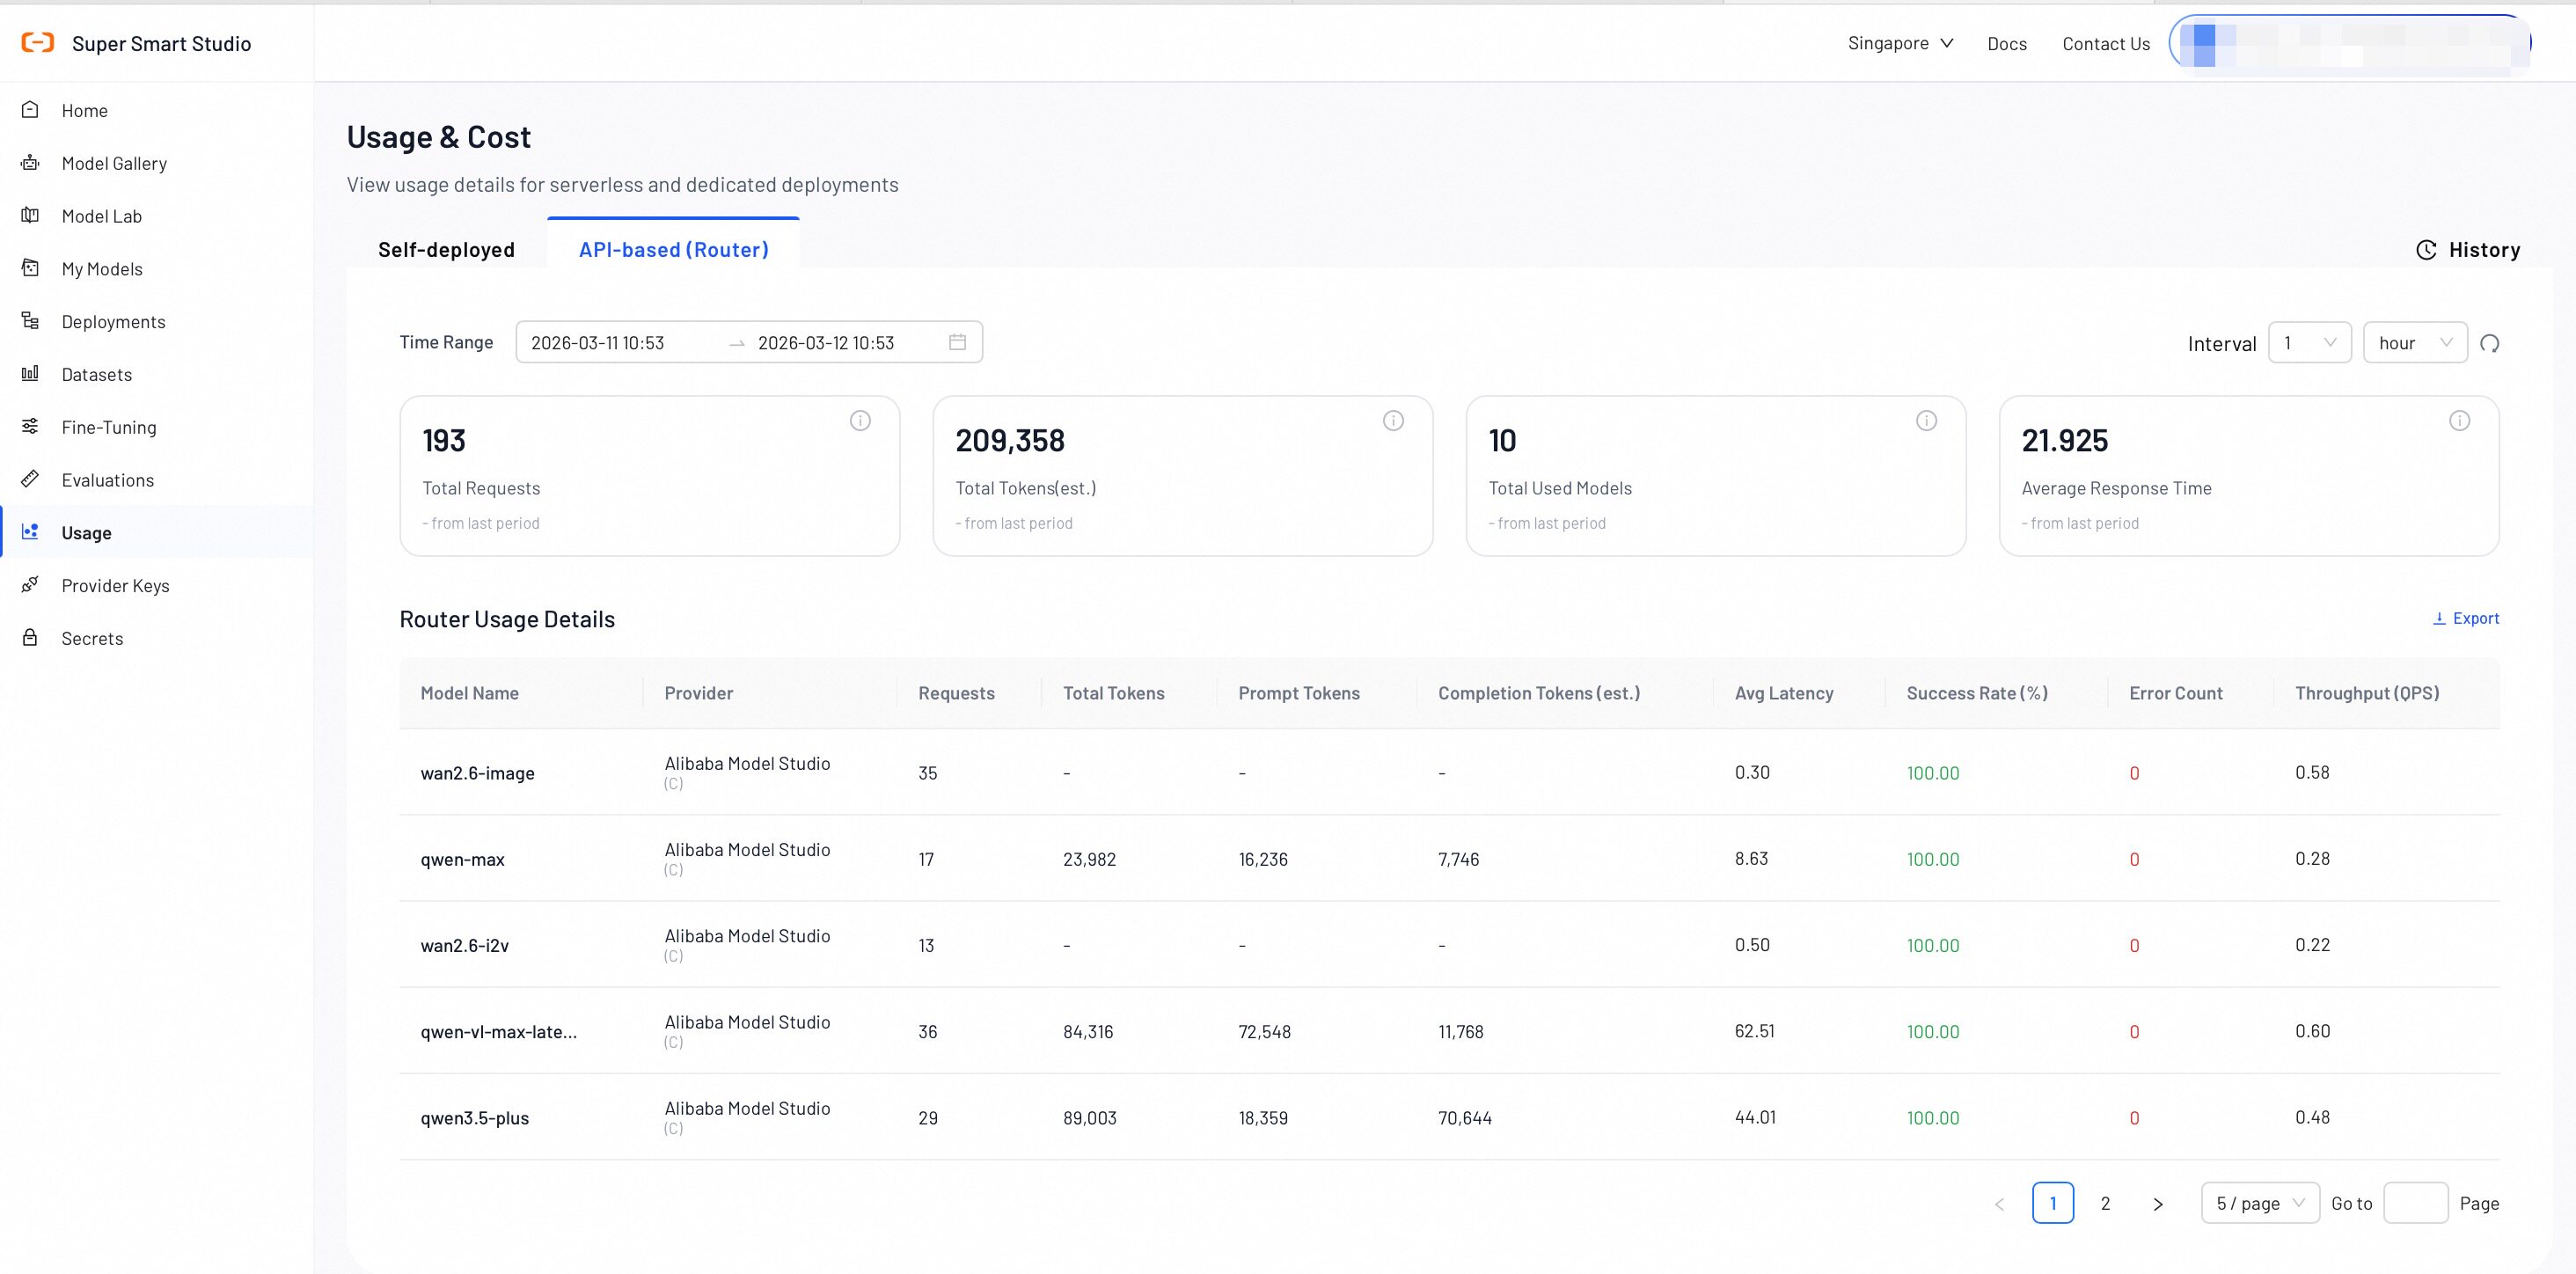
Router Metrics Overview
- Total Requests: The total number of API requests processed by the router.
- Total Tokens (est.): The estimated total number of tokens consumed by all router requests.
- Used Models: The number of unique AI models accessed through the router during the selected time period.
- Average Latency: The average response latency for router requests measured in seconds.
Serverless Usage Details
| Name | Description |
|---|---|
| Model Name | The specific AI model identifier used for serverless inference. |
| API Key | The API key used to make the request. |
| Requests | The number of API calls made to this specific model through the router. |
| Total Tokens (est.) | The estimated token consumption for this model, including both input and output tokens. |
| Input | Detailed breakdown of input token usage by pricing category (e.g., prompt tokens, cached tokens, audio tokens). Each row displays the factor label, count, and unit. |
| Output | Detailed breakdown of output token usage by pricing category (e.g., completion tokens, reasoning tokens, image tokens). Each row displays the factor label, count, and unit. |
| Avg Latency (s) | The average response latency for this specific model, measured in seconds. |
| Success Rate (%) | The percentage of successful requests for this model. |
| Error Count | The total number of failed requests for this model during the selected time period. |
| Total Fee | The total cost incurred for this model during the selected time period, displayed in USD. |
| Throughput (QPS) | The number of queries processed per second by this model. |
| Time | The time bucket for this usage record, displayed in hourly intervals (e.g., 2026-04-21 14:00). |
Export Usage Data
Click the Export button in the upper-right corner to download your router usage data as an Excel file. The export runs asynchronously — a loading indicator appears while the file is generated, and the download starts automatically once ready.
History
The History section provides detailed, request-level tracking and auditing capabilities. Here, you can search, filter, and analyze individual API requests to understand usage patterns, troubleshoot issues, and optimize your AI applications.
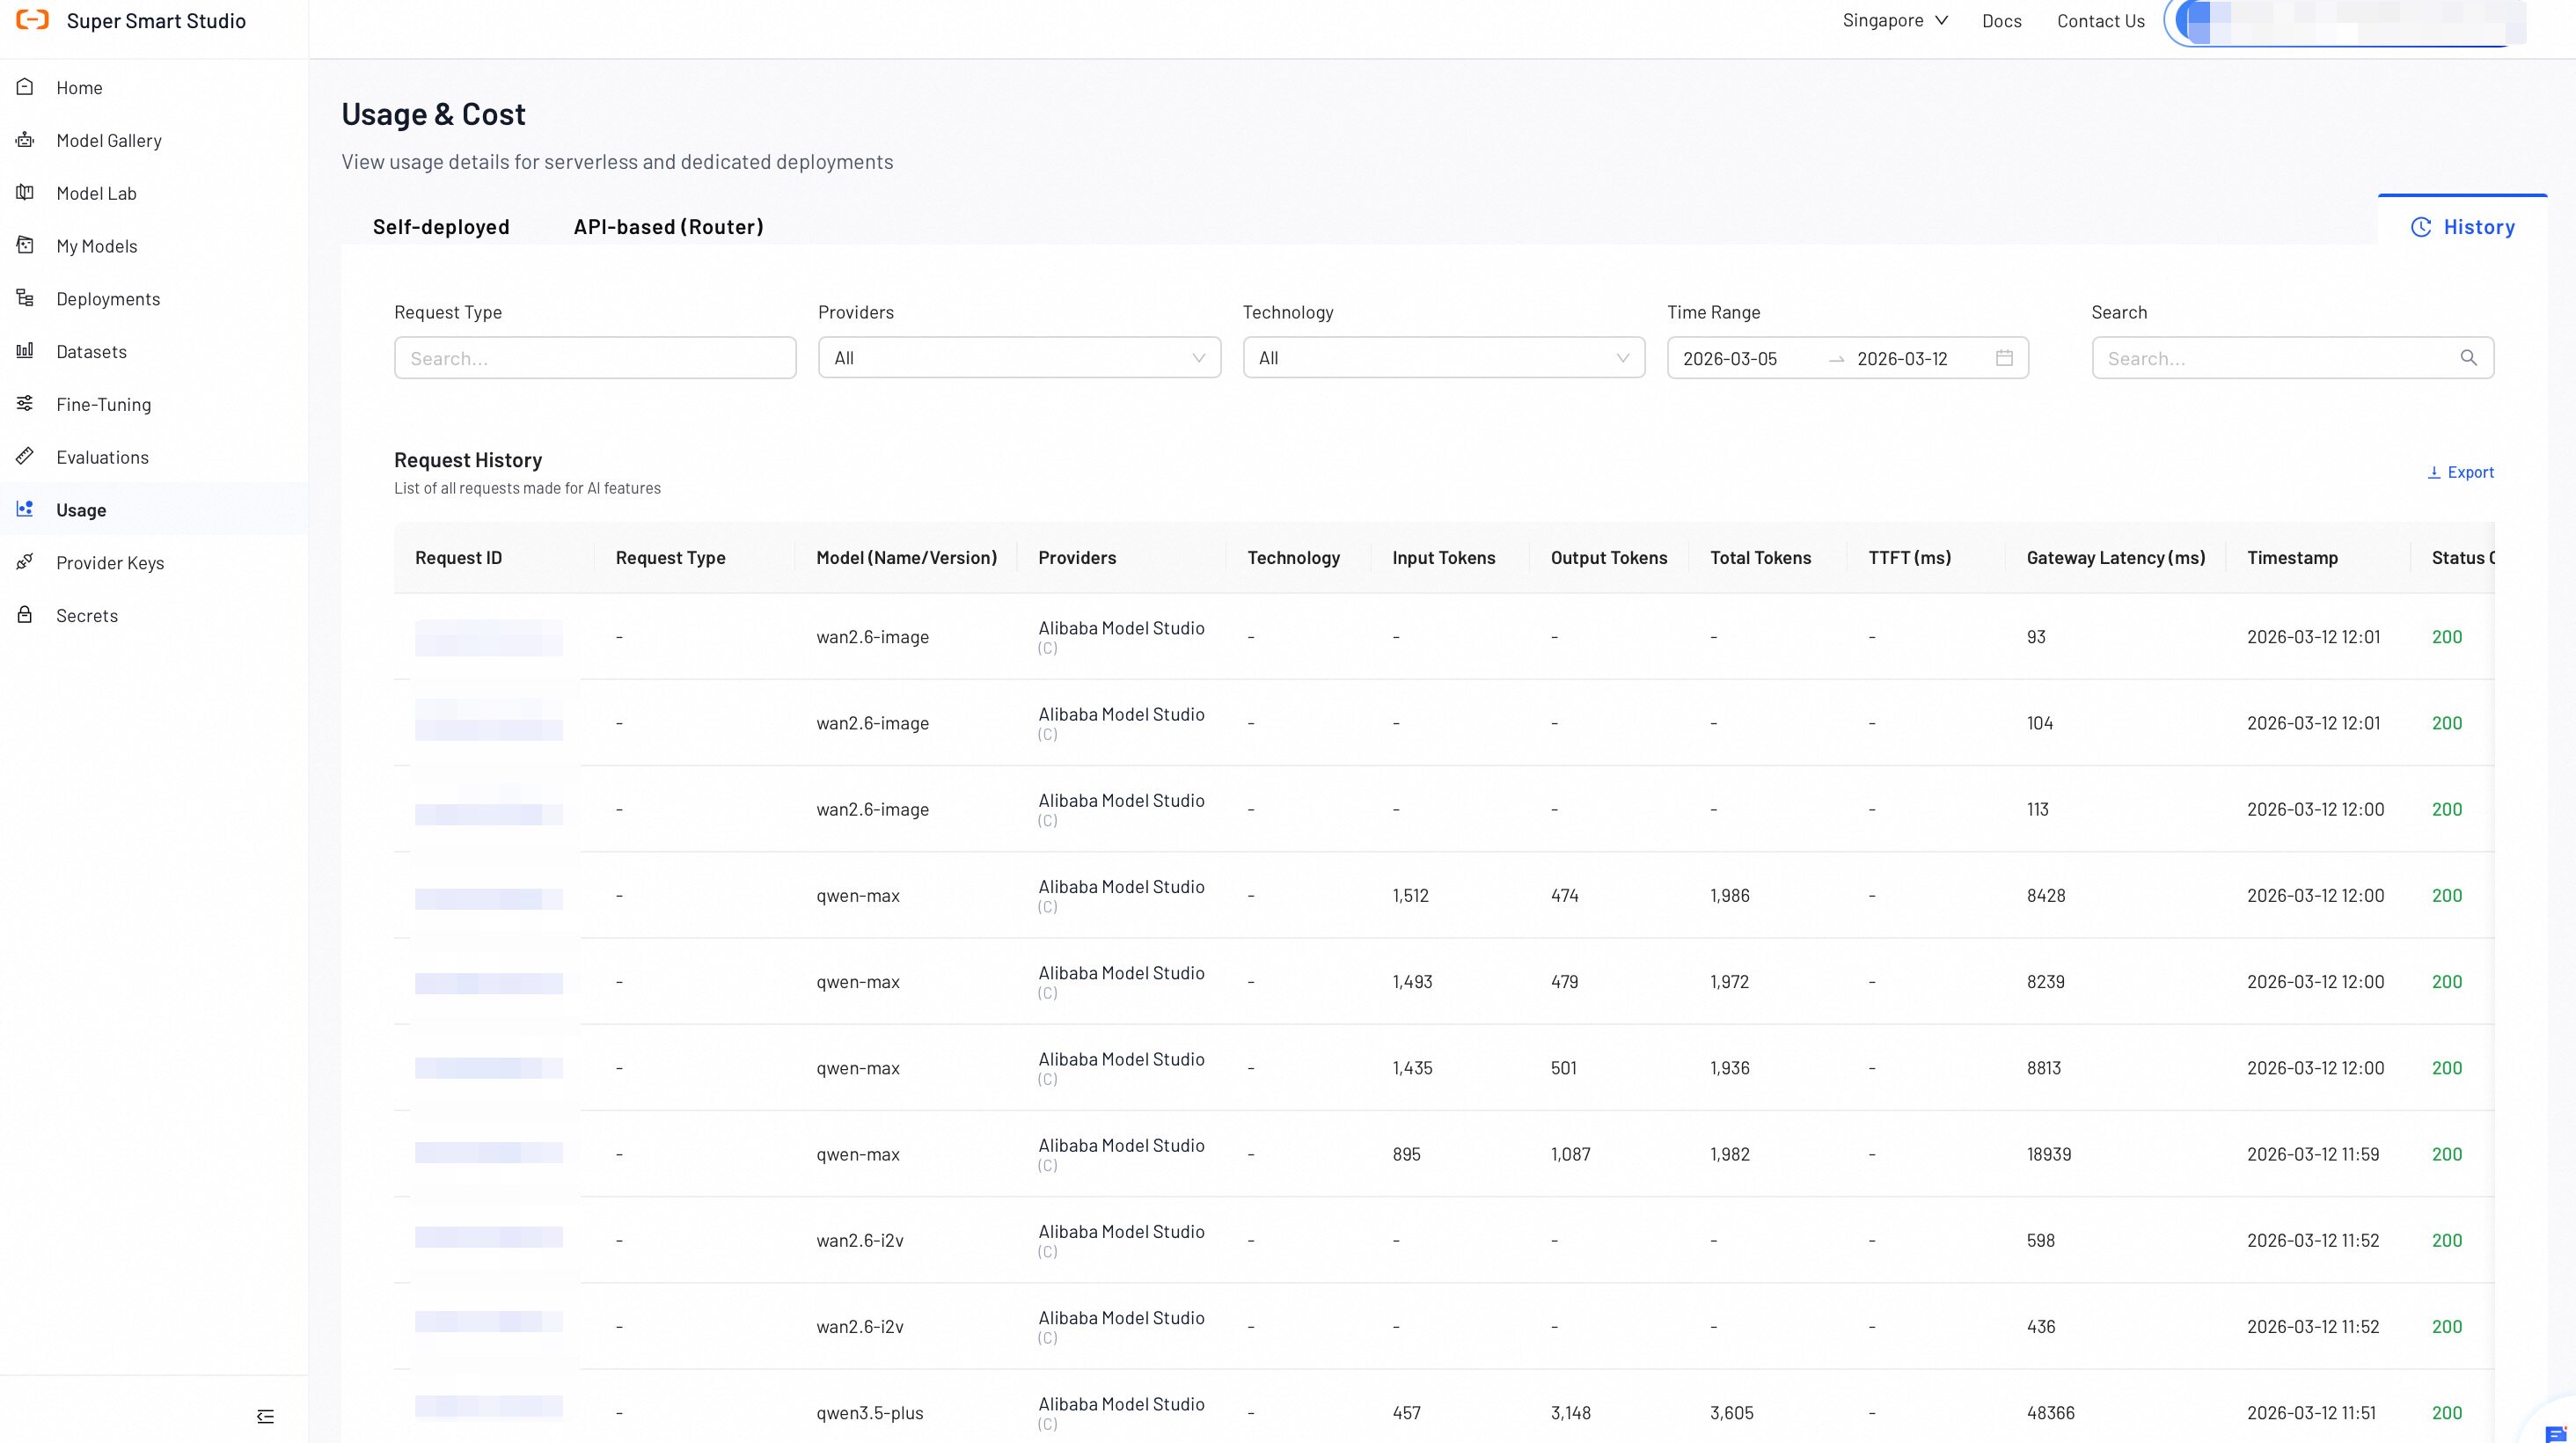
Request Details Table
| Name | Description |
|---|---|
| Request ID | The unique identifier for each API request. |
| Request Type | The category of the AI operation performed (e.g., "AI Datasets Preparation," "AI Model Recommend"). |
| Model (Name/Version) | The specific AI model and version used for the request. |
| Providers | The service provider that processed the request. |
| Technology | The AI technology category (e.g., LLM, VLM) used for the request. |
| Input Tokens | The number of input tokens sent to the model. |
| Output Tokens | The number of output tokens generated by the model. |
| Total Tokens | The total token consumption for the request, including both input and output tokens. |
| TTFT | Time to First Token - the time in milliseconds until the first token is generated. |
| Gateway Latency (ms) | The time taken for the request to pass through the gateway, measured in milliseconds. |
| Timestamp | The exact date and time when the request was processed. |
| Status Code | The HTTP status code that indicates whether the request was successful (e.g., 200) or if it failed. |
| Error Message | The detailed error information for a failed request. |
- Monitor utilization percentages to optimize resource allocation and reduce costs
- Use the History section to identify peak usage times and plan capacity accordingly
- Track error rates and latency to ensure optimal user experience
- Compare token usage across different models to optimize cost-performance ratios
Next Steps
Check your billing summary, payment methods, and cost breakdown by service category.
Review and manage your active model deployments to optimize resource usage.