Dashboard
The Admin Dashboard is the central monitoring hub for platform operators. It provides real-time visibility into API traffic, GPU resource consumption, and provider key health — all in a single unified view. Access requires the Dashboard permission.
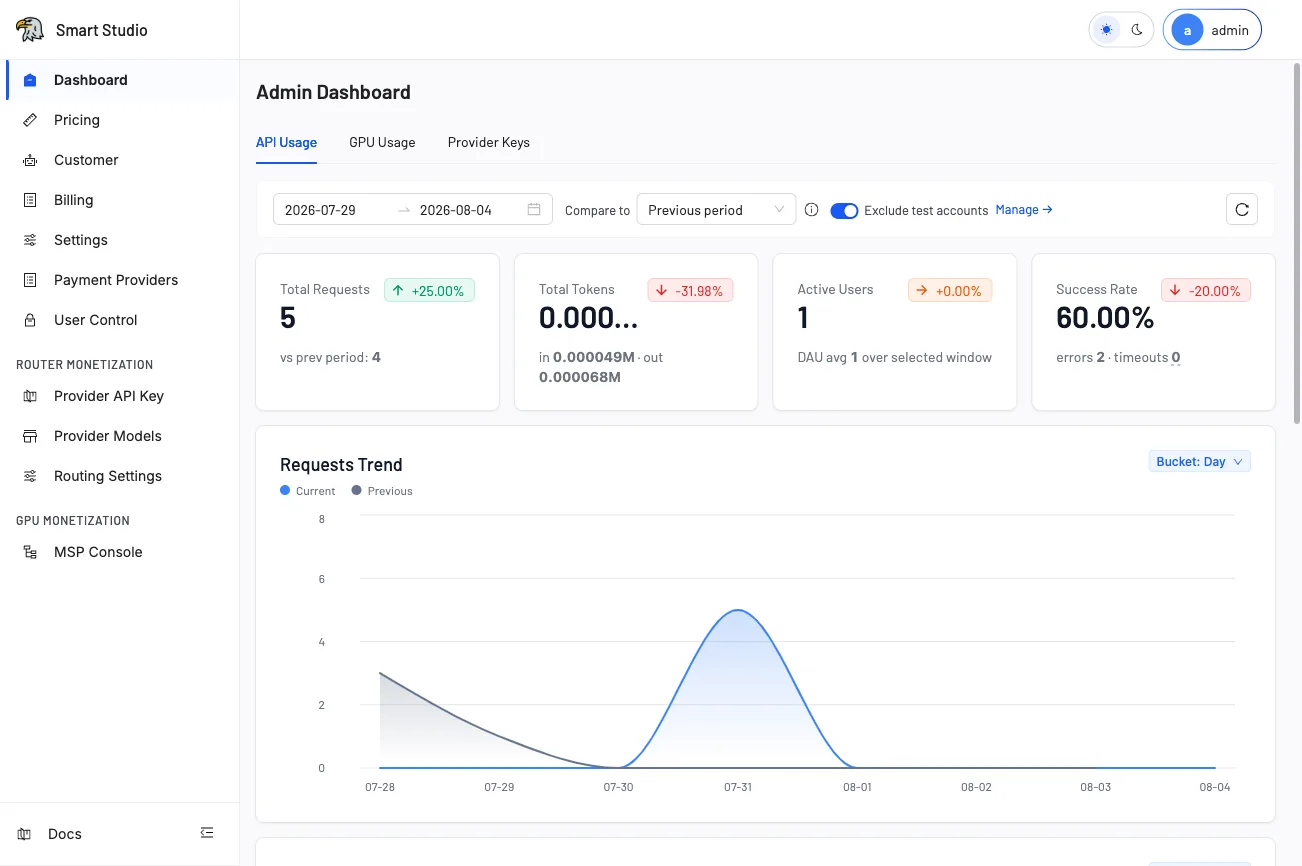
Overview
The Dashboard is organized into three primary tabs: API Usage, GPU Usage, and Provider Keys. Each tab surfaces the metrics most relevant to its domain, with configurable date ranges and comparison periods. A toolbar at the top allows you to set the observation window, compare against a previous period, and toggle test-account exclusion.
API usage tab
The API Usage tab is the default view and presents the following key metrics:
Summary cards
| Metric | Description |
|---|---|
| Total Requests | Aggregate API call count for the selected window, with period-over-period change percentage. |
| Total Tokens | Combined input and output token consumption (displayed in millions). Shows breakdown of input vs. output tokens. |
| Active Users | Daily Active Users (DAU) averaged over the selected window. |
| Success Rate | Percentage of non-error responses. Displays error count and timeout count separately. |
Each card shows a directional indicator (↑ green for improvement, ↓ red for regression) comparing against the previous period.
Requests trend chart
Below the summary cards, a Requests Trend line chart plots request volume over time. You can switch the bucket granularity (Day, Hour) using the dropdown in the top-right corner of the chart. The chart overlays current and previous period data for visual comparison.
Toolbar options
- Date Range Picker — Select start and end dates for the observation window.
- Compare to — Choose a comparison baseline (e.g., Previous period, Same period last month).
- Exclude test accounts — Toggle to filter out internal test traffic from all metrics.
- Manage → — Link to manage test-account definitions.
- Refresh — Manually reload metrics data.
GPU usage tab
The GPU Usage tab displays resource utilization for self-deployed GPU clusters. This tab is available after you activate the Model Serving Platform.
Key metrics include:
- GPU hours consumed per cluster and model.
- Utilization percentage across provisioned capacity.
- Cost attribution by deployment.
Use this tab to identify under-utilized clusters or models approaching capacity limits.
Provider keys tab
The Provider Keys tab shows the status and usage of configured upstream provider API keys:
- Key identifier and associated provider name.
- Request count and token volume routed through each key.
- Error rate and rate-limit proximity warnings.
- Last-used timestamp for staleness detection.
Tips
- Dashboard data refreshes automatically every 60 seconds. Use the manual refresh button for immediate updates.
- The "Exclude test accounts" toggle persists across sessions — remember to disable it when debugging test-user issues.
- Export functionality is available on individual metric cards for reporting purposes.
- All timestamps are displayed in the tenant's configured timezone.
Next Step
- Configure tenant identity in Sign-in Methods and SSO.
- Review commercial configuration in Pricing or Billing.
- Start a GPU workflow in Model Serving Platform.