Observability
CPU Observability is the operational view for clusters activated under the API Router Platform. It provides a real-time dashboard that helps you monitor CPU usage, API request volume, latency, error rates, and other performance metrics of your reseller infrastructure.
Before you begin
- The cluster must be in the Activated state.
- The API Router Platform is fully deployed.
Open CPU Observability
- In the Console, open Activate Cluster.
- Find a Router-mode activation with the Activated status.
- In Actions, select the CPU Observability icon.
Control the view
- Backend / Gateway — switch the scope between the reseller backend service and the gateway.
- Time window — choose 15m, 1h, 6h, 24h, or 7d. Longer windows use coarser sampling steps so charts stay readable.
- Auto refresh — set to Off, 30s, 1m, or 5m. The system automatically extends the interval when the window's sampling step is slower, to avoid redundant refetches. The effective interval is shown in the selector.
- Refresh now — reload all panels immediately.
- Refreshed N ago — shows when data was last fetched.
Read the health strip
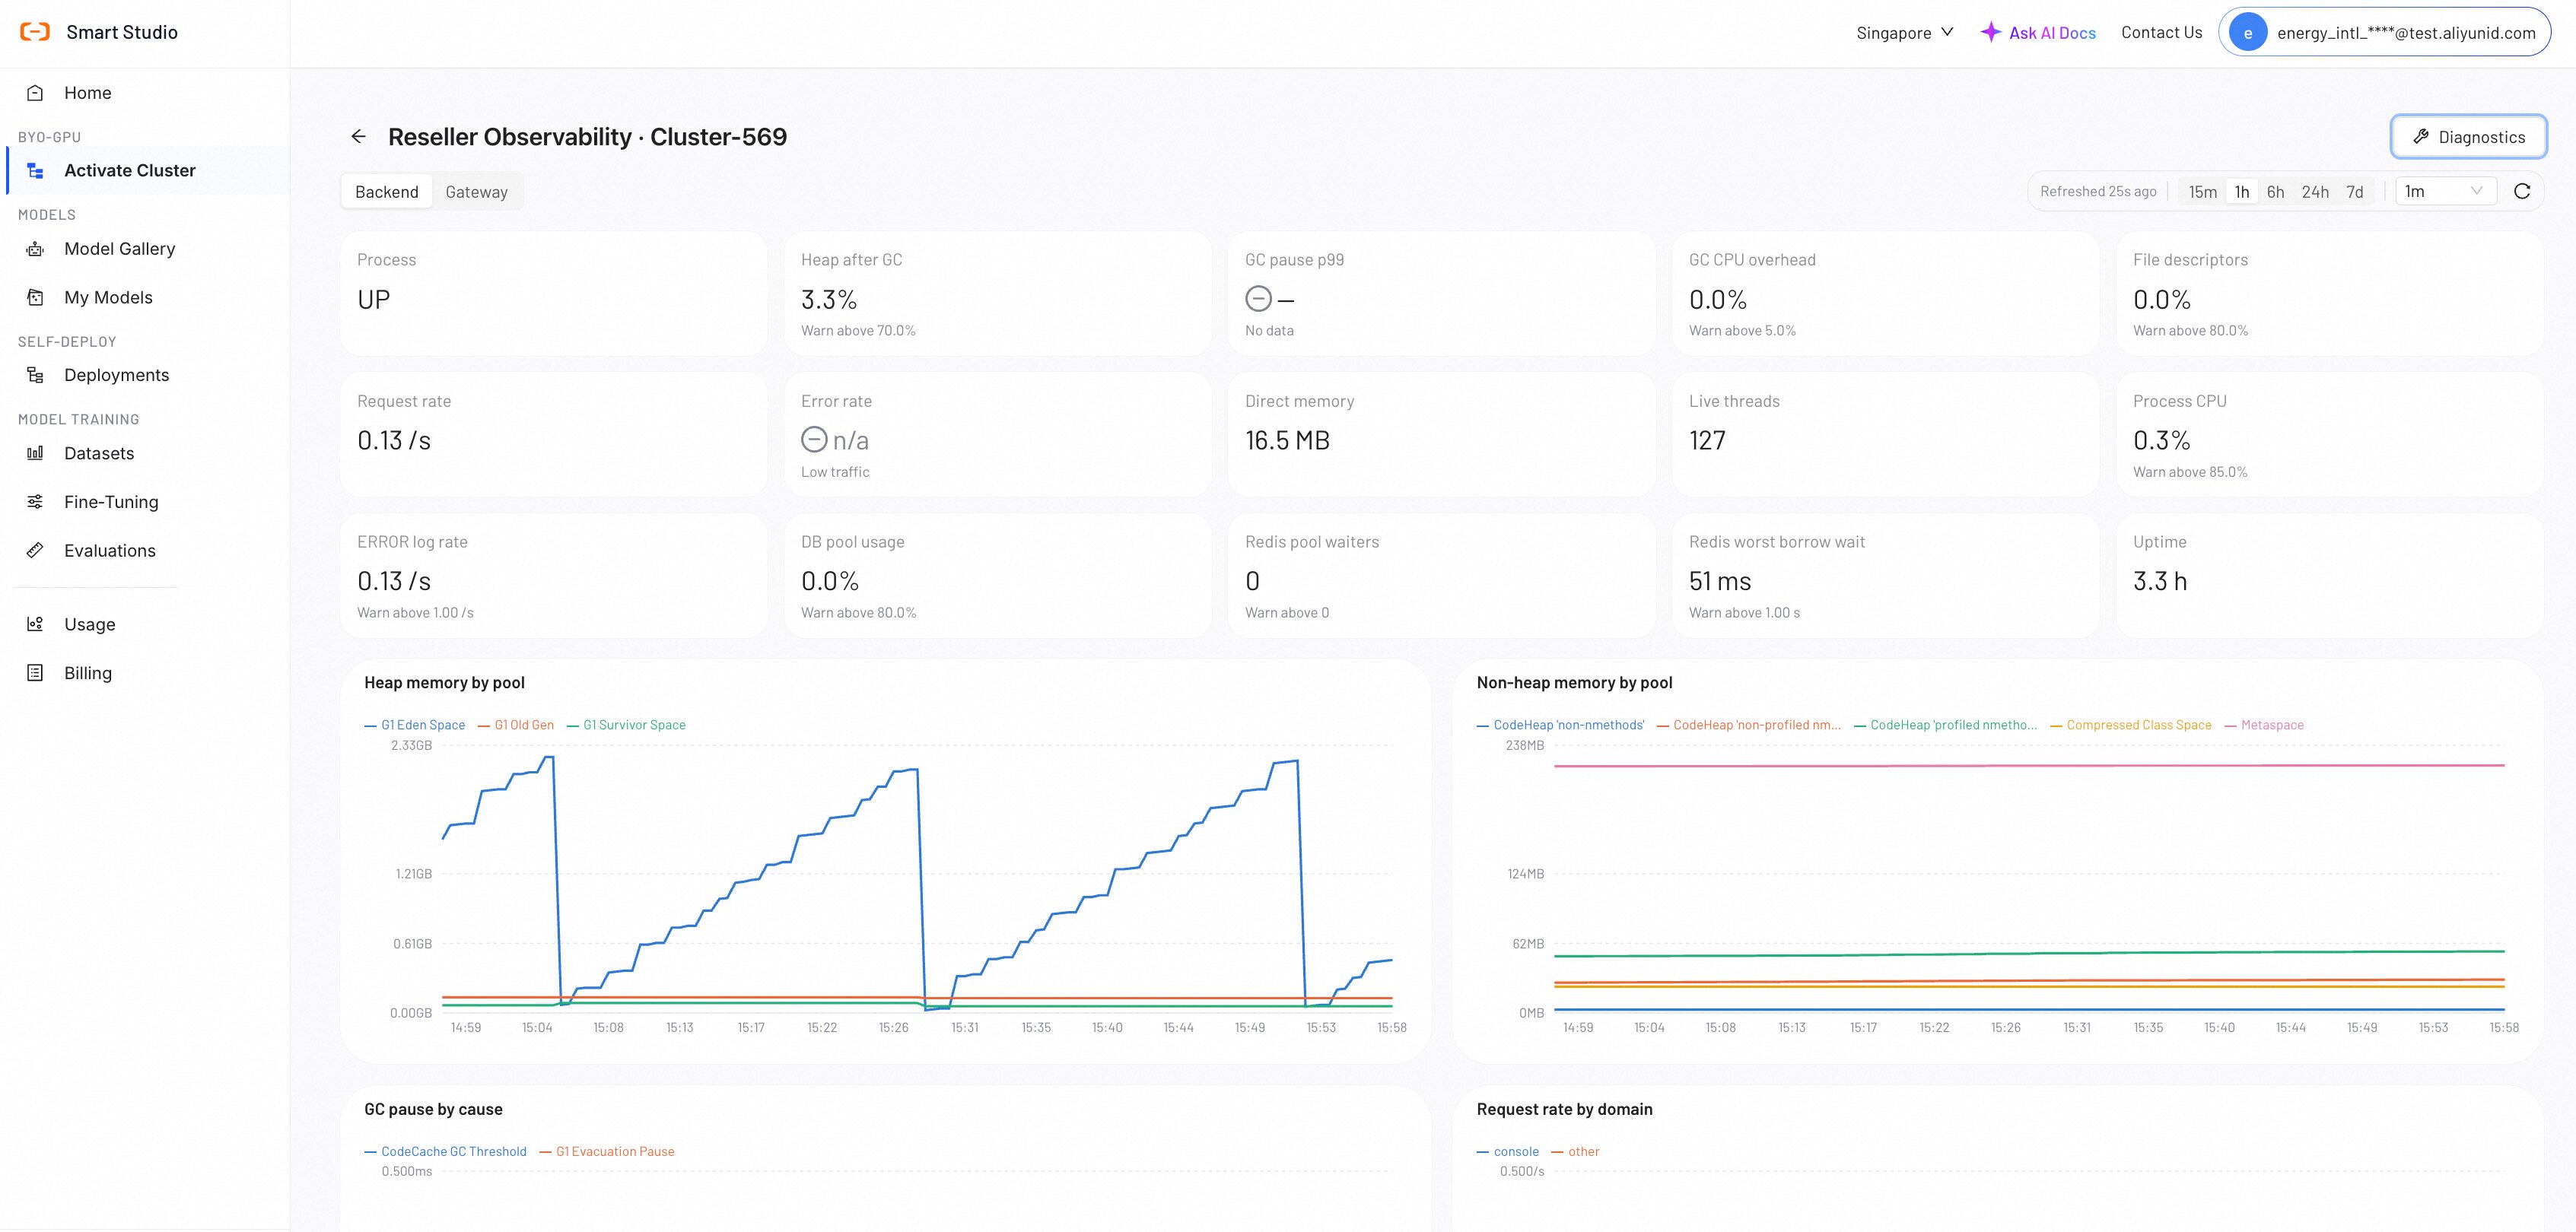
The health strip summarizes key indicators as cards. Each card shows the current value, the data-collection time, and a warning hint when a threshold is crossed. The page shows Low traffic for metrics with no traffic in the window.
Backend scope
| Indicator | Warns when |
|---|---|
| Process | Process is down. |
| Heap after GC | Heap usage after GC exceeds 70%. |
| GC pause p99 | Pause exceeds 1 second. |
| GC CPU overhead | Garbage collection exceeds 5% of CPU. |
| File descriptors | Descriptor usage exceeds 80%. |
| Request rate | No threshold; watch for anomalies. |
| Error rate | Error ratio exceeds 5%. |
| Direct memory | No threshold; watch for growth. |
| Live threads | No threshold; watch for growth. |
| Process CPU | CPU usage exceeds 85%. |
| ERROR log rate | More than one ERROR log event per second. |
| DB pool usage | Connection pool usage exceeds 80%. |
| Redis pool waiters | Any thread is waiting for a Redis connection. |
| Redis worst borrow wait | No threshold; watch for growth. |
| Uptime | Process uptime since start. |
Gateway scope
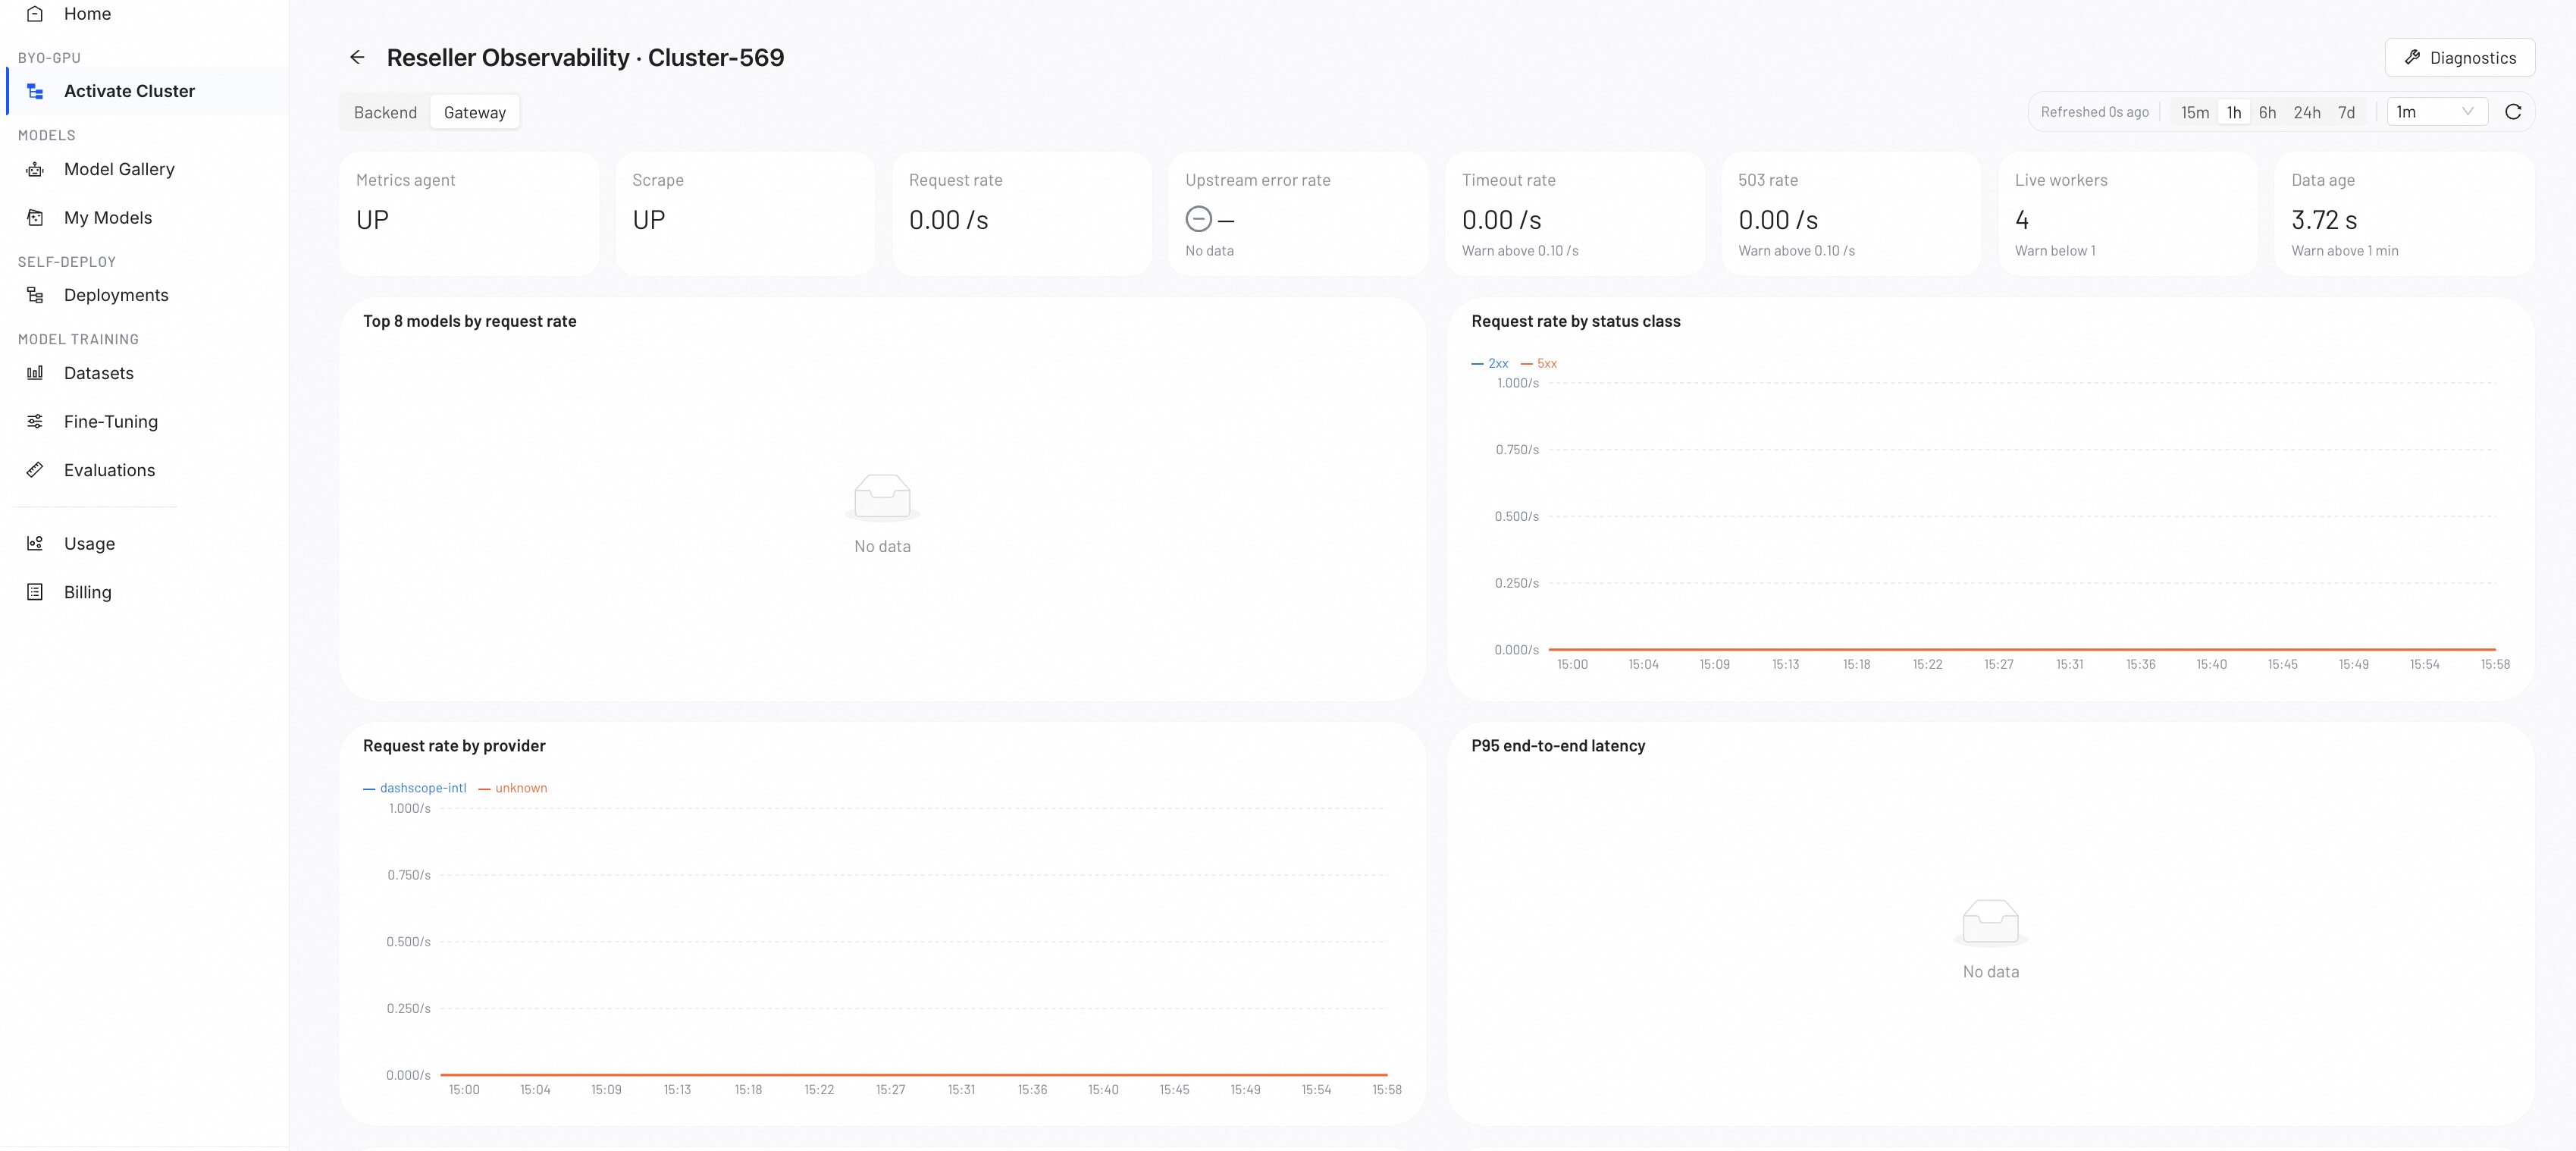
| Indicator | Warns when |
|---|---|
| Metrics agent | The agent is down. |
| Scrape | The gateway scrape target is down. |
| Request rate | No threshold; watch for anomalies. |
| Upstream error rate | Upstream error ratio exceeds 5%. |
| Timeout rate | Timeout ratio exceeds 10%. |
| 503 rate | 503 response rate exceeds 10%. |
| Live workers | No live workers. |
| Data age | Snapshot is older than 60 seconds. |
Read time-series charts
The page groups charts by concern. Hover over a chart for exact values; each chart includes a hint that explains how to read it. Typical groups include heap and non-heap memory by pool, GC pause and allocation rates, request rate and latency by domain, top endpoints by request rate, error rates by status code, thread pools, database pool usage, and gateway upstream metrics.
Use the time window selector to align all charts with the period you are investigating.
Run diagnostics
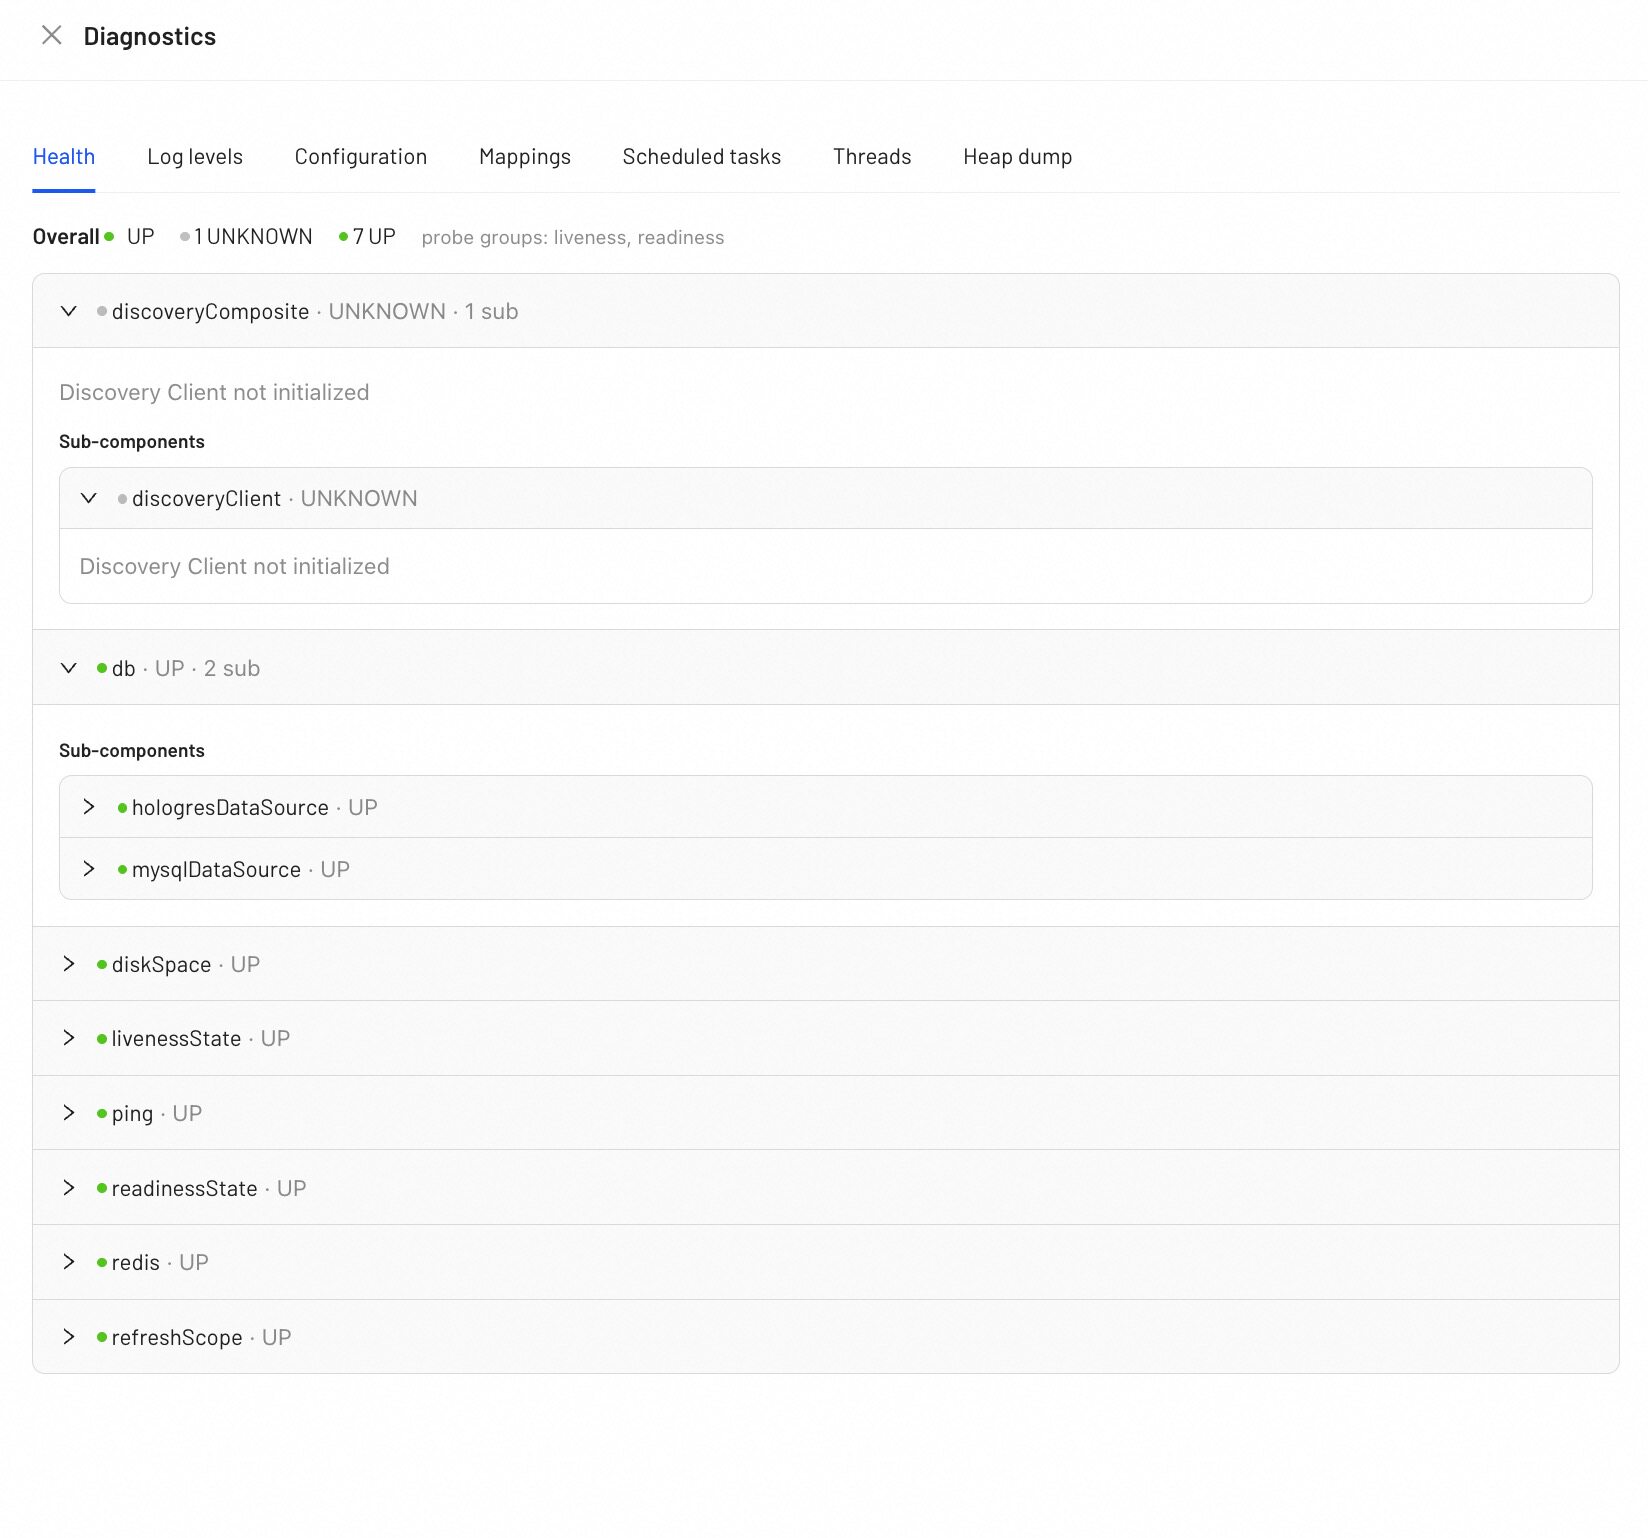
Select Diagnostics to open a drawer with live Spring Boot actuator data for the backend:
| View | What it shows |
|---|---|
| Health | Application health endpoints and their status. |
| Env | Environment properties with effective and configured values. |
| Mappings | HTTP request mappings registered by the backend. |
| Scheduled Tasks | Scheduled jobs and their last execution. |
| Threads | Live thread list and stack traces. |
| Loggers | Loggers with their levels, searchable by name. |
Troubleshooting
The entry is not available
The CPU Observability entry appears only for Activated Router-mode clusters. For Activating records, select Manage and complete the activation first. When the cluster is disconnected, the entry is disabled until connectivity is restored.
A card shows Fetch failed
The panel could not load its metric source. The page separates fetch failures from genuinely missing data, so a failed card does not zero out the rest of the strip. Select Refresh now to retry.
Data looks stale
Check the Data age indicator on the gateway scope and the Refreshed N ago label. If the page was in a background tab, auto refresh was paused; returning to the tab triggers an immediate refresh.