GPU Observability
GPU Observability is the operational view for an activated cluster. Use it after activation to confirm that GPU capacity is visible, identify unhealthy nodes, and inspect the resources used by model-serving workloads.
Before you begin
- The cluster must be in the Activated state.
- The Model Serving Platform is fully deployed.
Open GPU Observability
- In the Console, open Activate Cluster.
- Find an activation with the Activated status.
- In Actions, select the GPU Observability chart icon.
GPU Observability opens the cluster associated with that activation. If the chart icon is unavailable, wait for activation to finish or use Manage to resume the activation workflow.
Read the cluster overview
The overview brings four operational views together:
| Area | What it tells you | What to check |
|---|---|---|
| Real-time Resource Utilization | Current cluster capacity and utilization. | Confirm the expected nodes and Compute Cards are reported. |
| Resource Utilization Trends | How resource use changes over the selected time range. | Look for sustained saturation or unexpected idle capacity. |
| Node List | Health and utilization for individual machines. | Open a node whose status or utilization differs from the rest. |
| Model Serving | Services consuming the cluster. | Open a service to investigate latency, throughput, cache, or availability. |
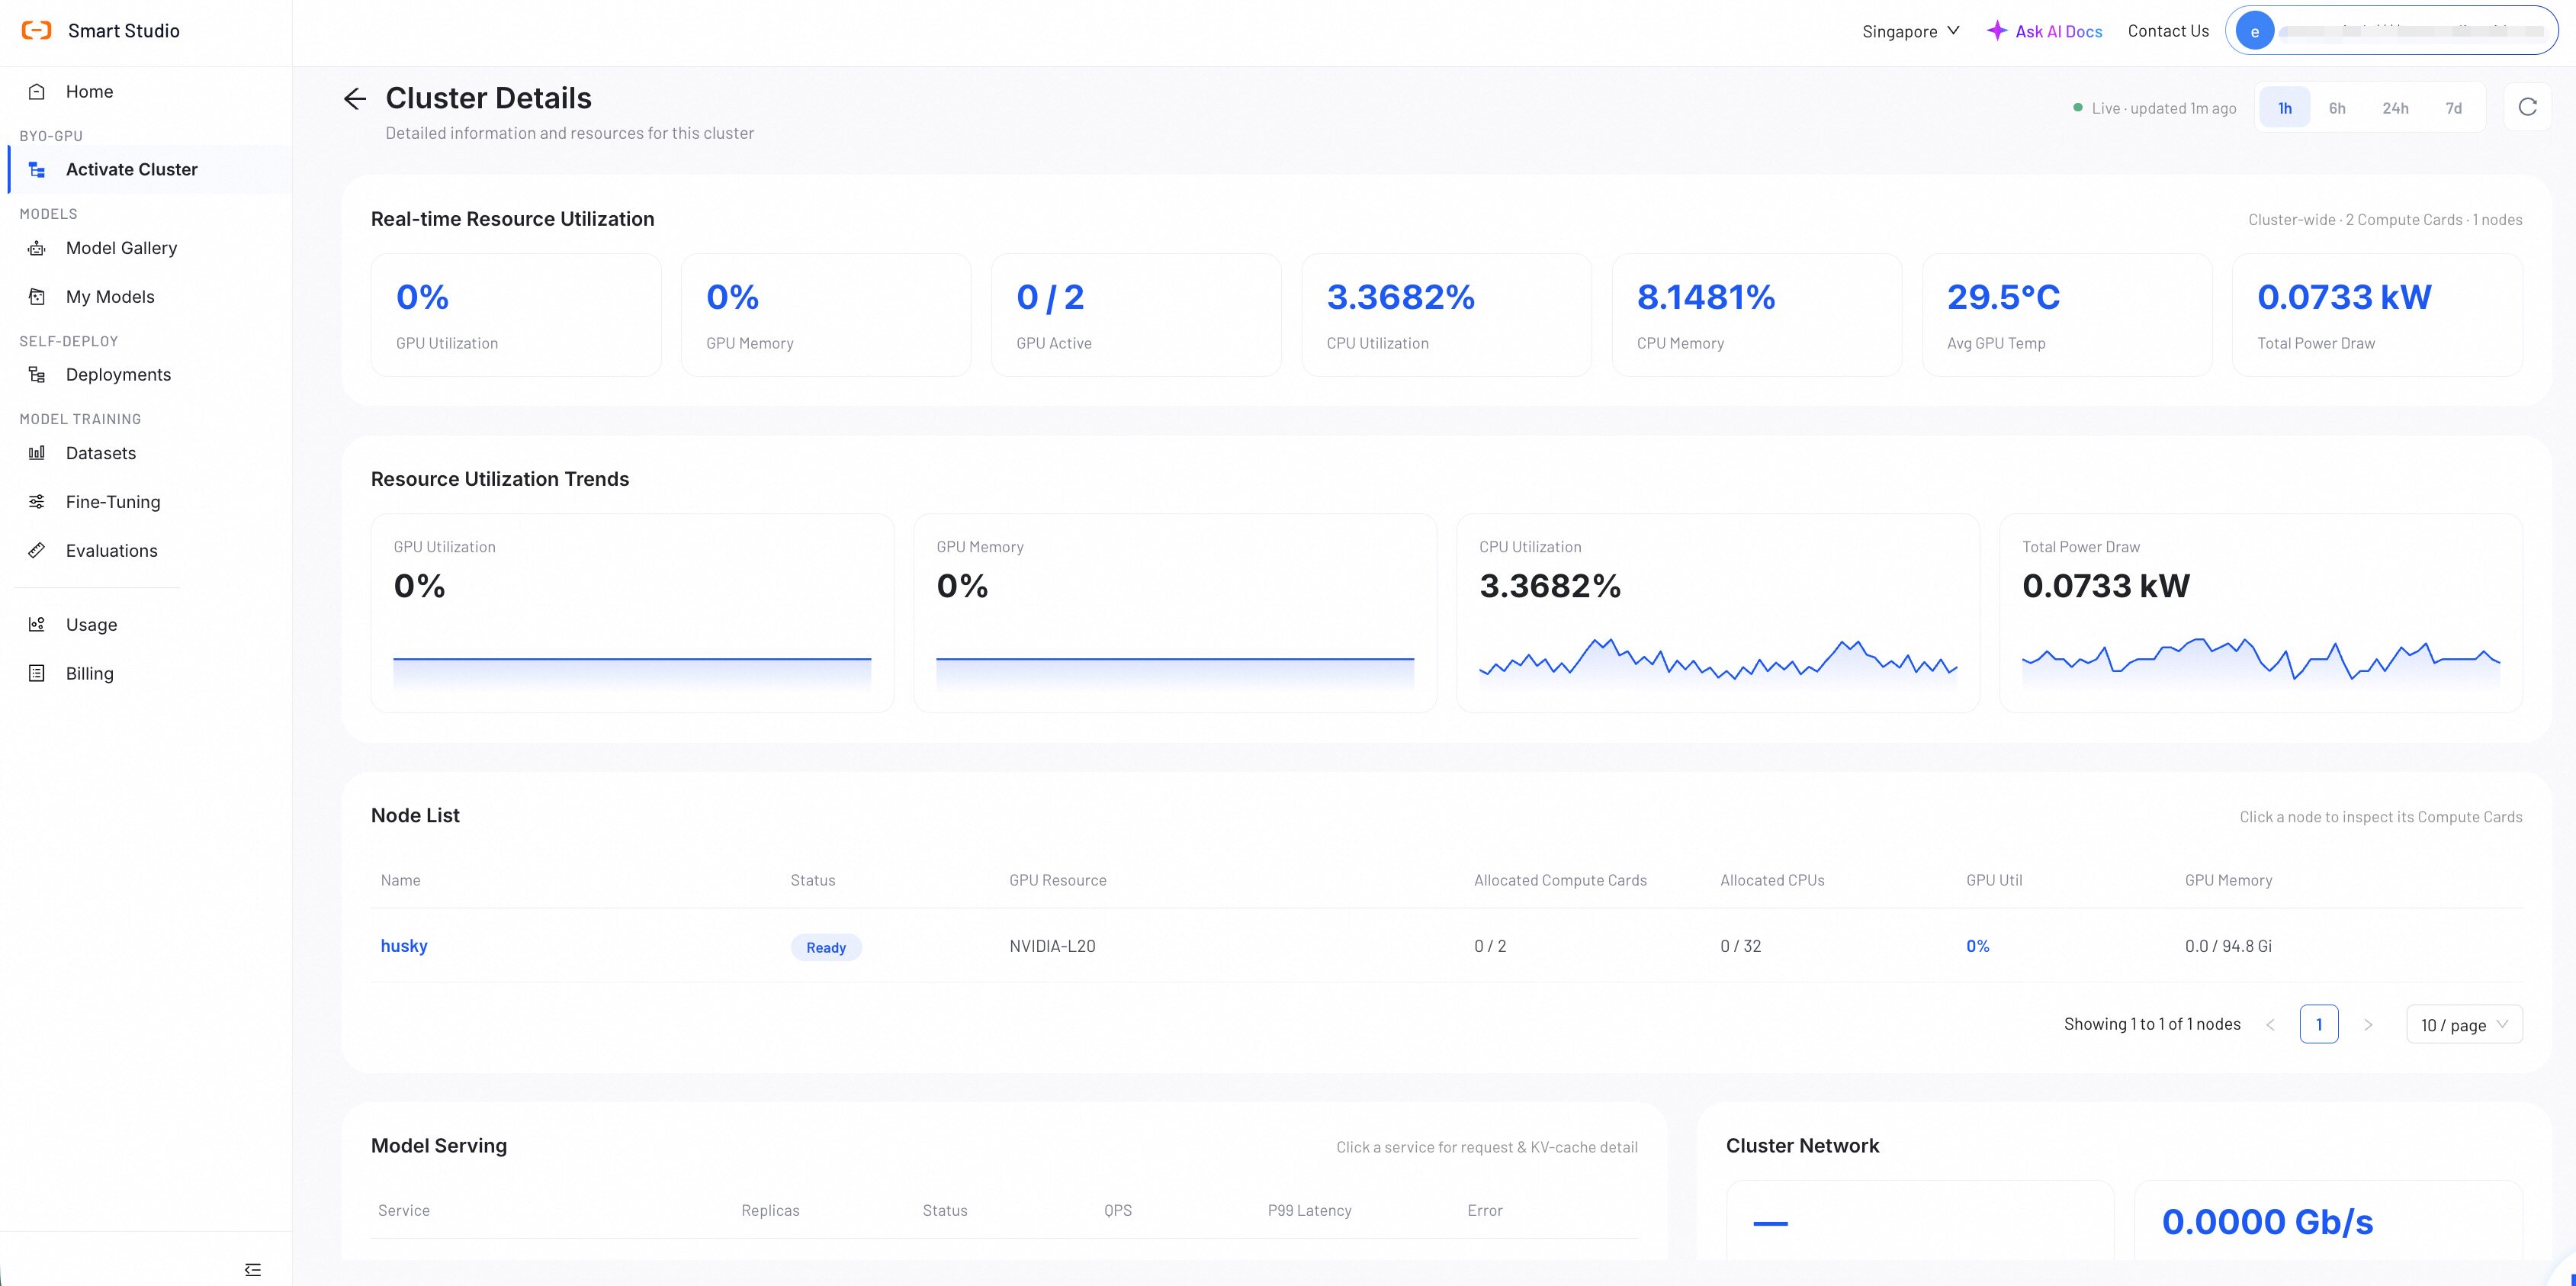
Use the range control to switch between 1h, 6h, 24h, and 7d. The header shows when the oldest panel was last updated. Select Refresh when you need a new snapshot immediately.
Inspect a Node
Select a node from the Node List to open its hardware view. Review:
- Node overview and health.
- GPU details and GPU utilization.
- CPU and storage consumption.
- Workloads currently assigned to each GPU.
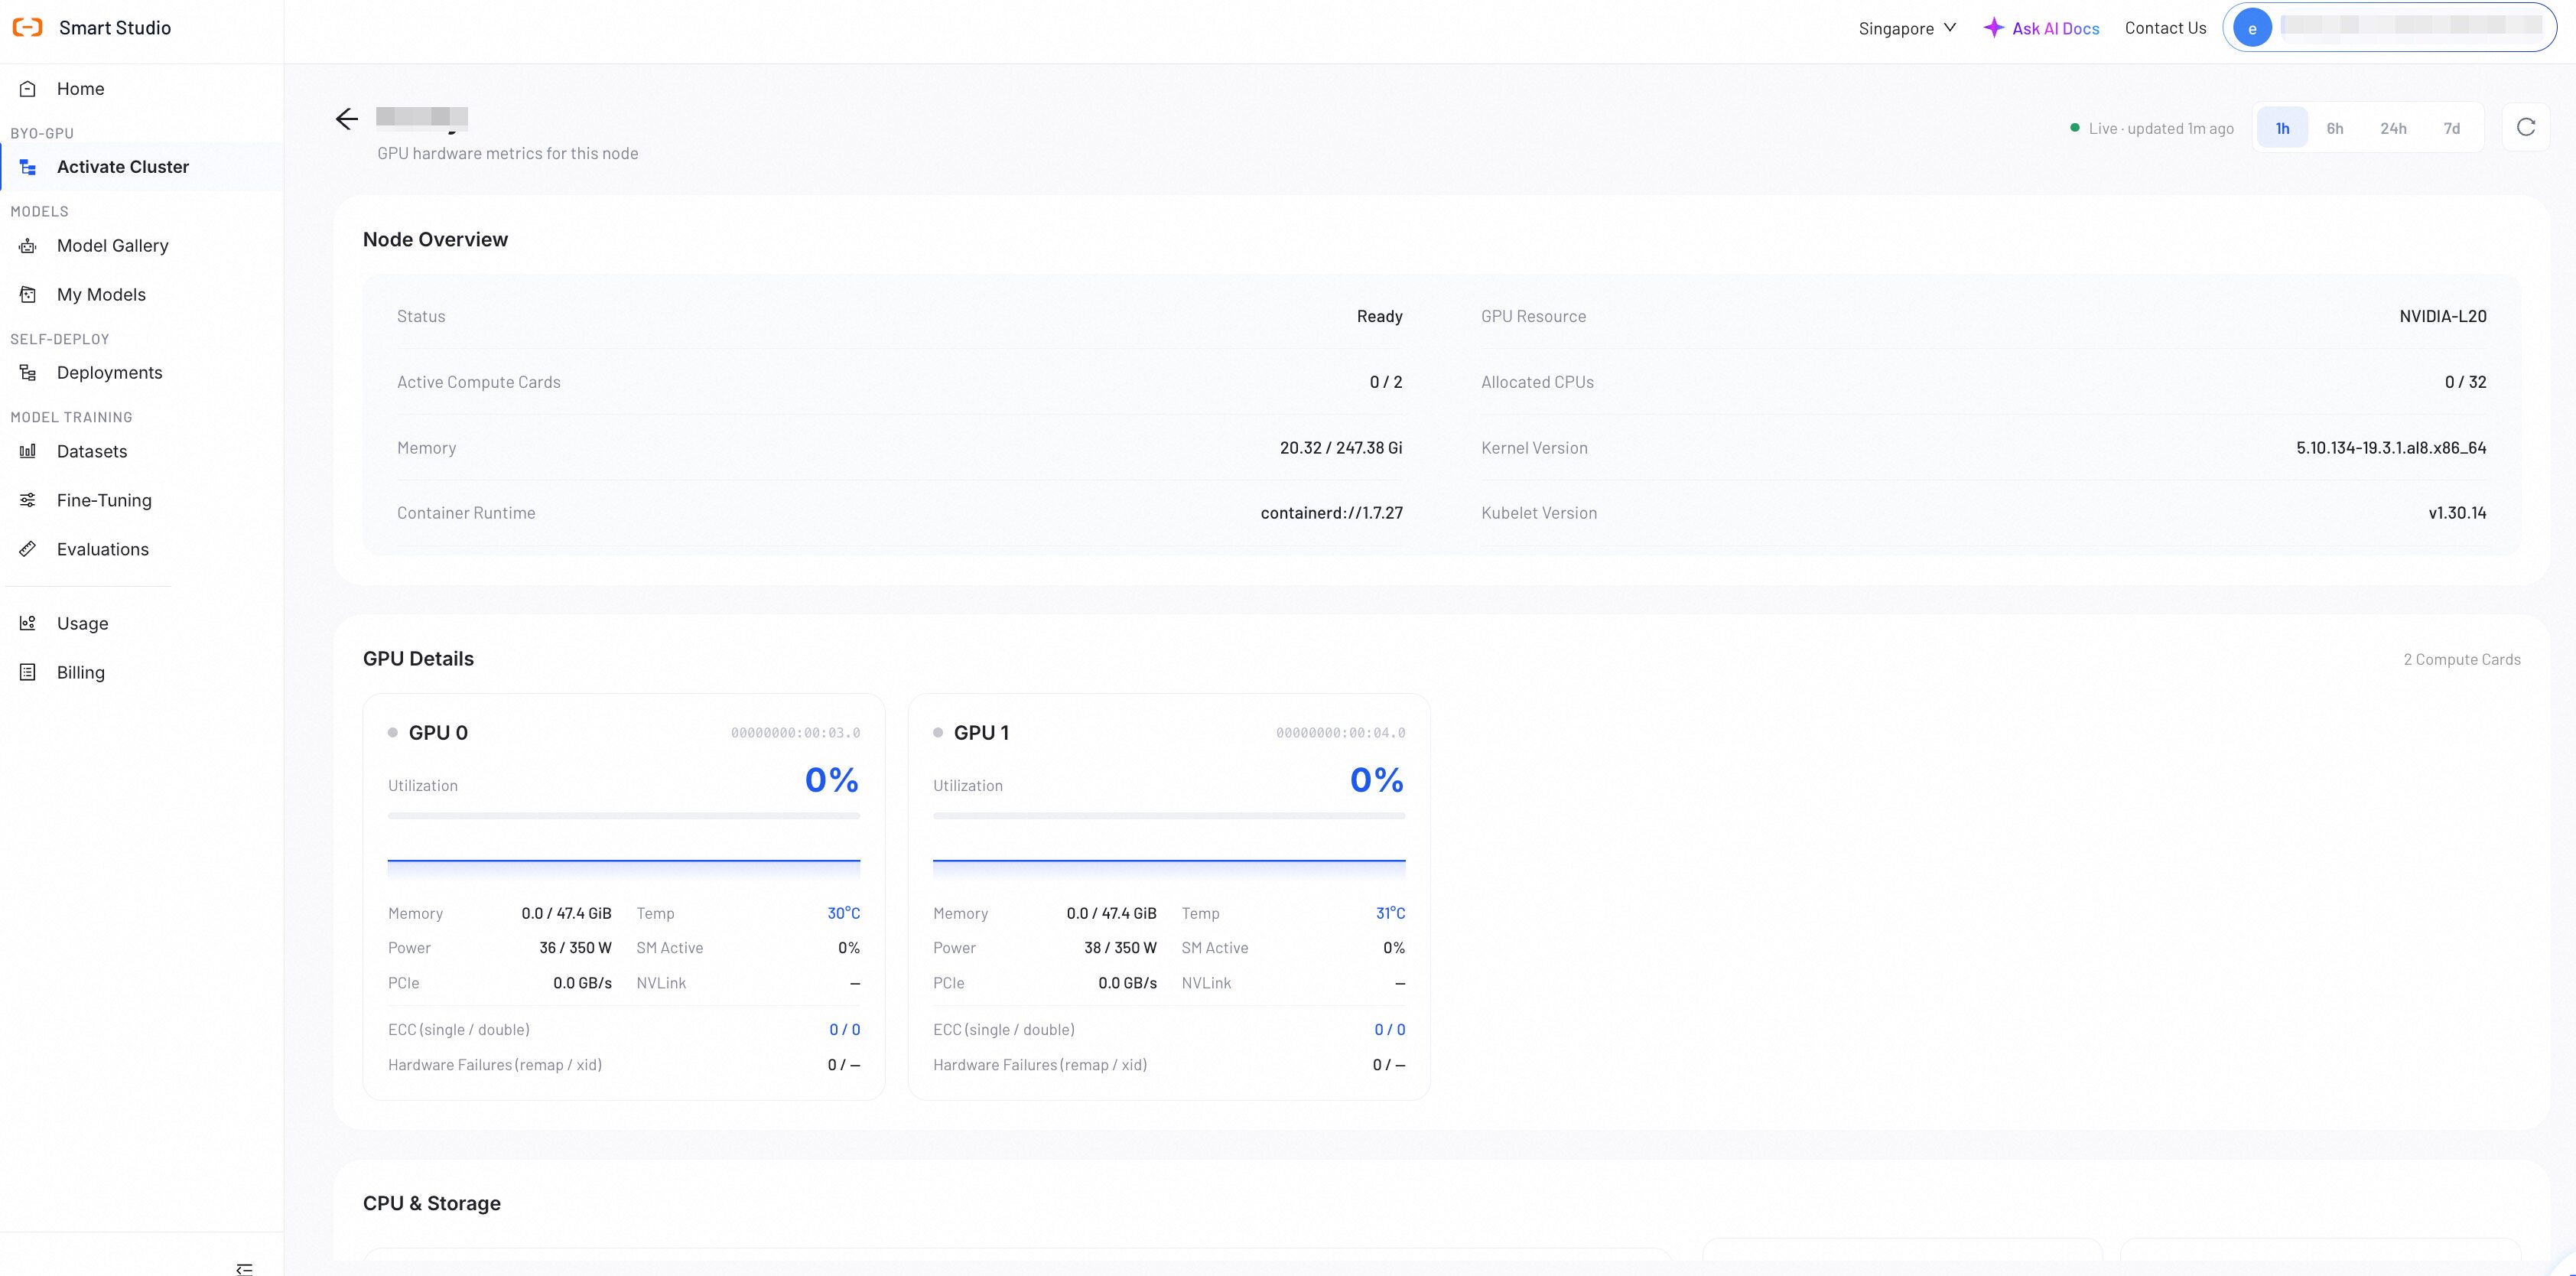
If a node is missing, disconnected, or consistently saturated, resolve the infrastructure issue before increasing deployment replicas.
Inspect a Model-Serving Service
Select a service from Model Serving to open its service view. Depending on the serving engine and enabled metrics, the page shows:
- End-to-end and inter-token latency.
- Request rate and token throughput.
- GPU and KV-cache efficiency.
- Service availability.
- Prefill/decode metrics for disaggregated serving.
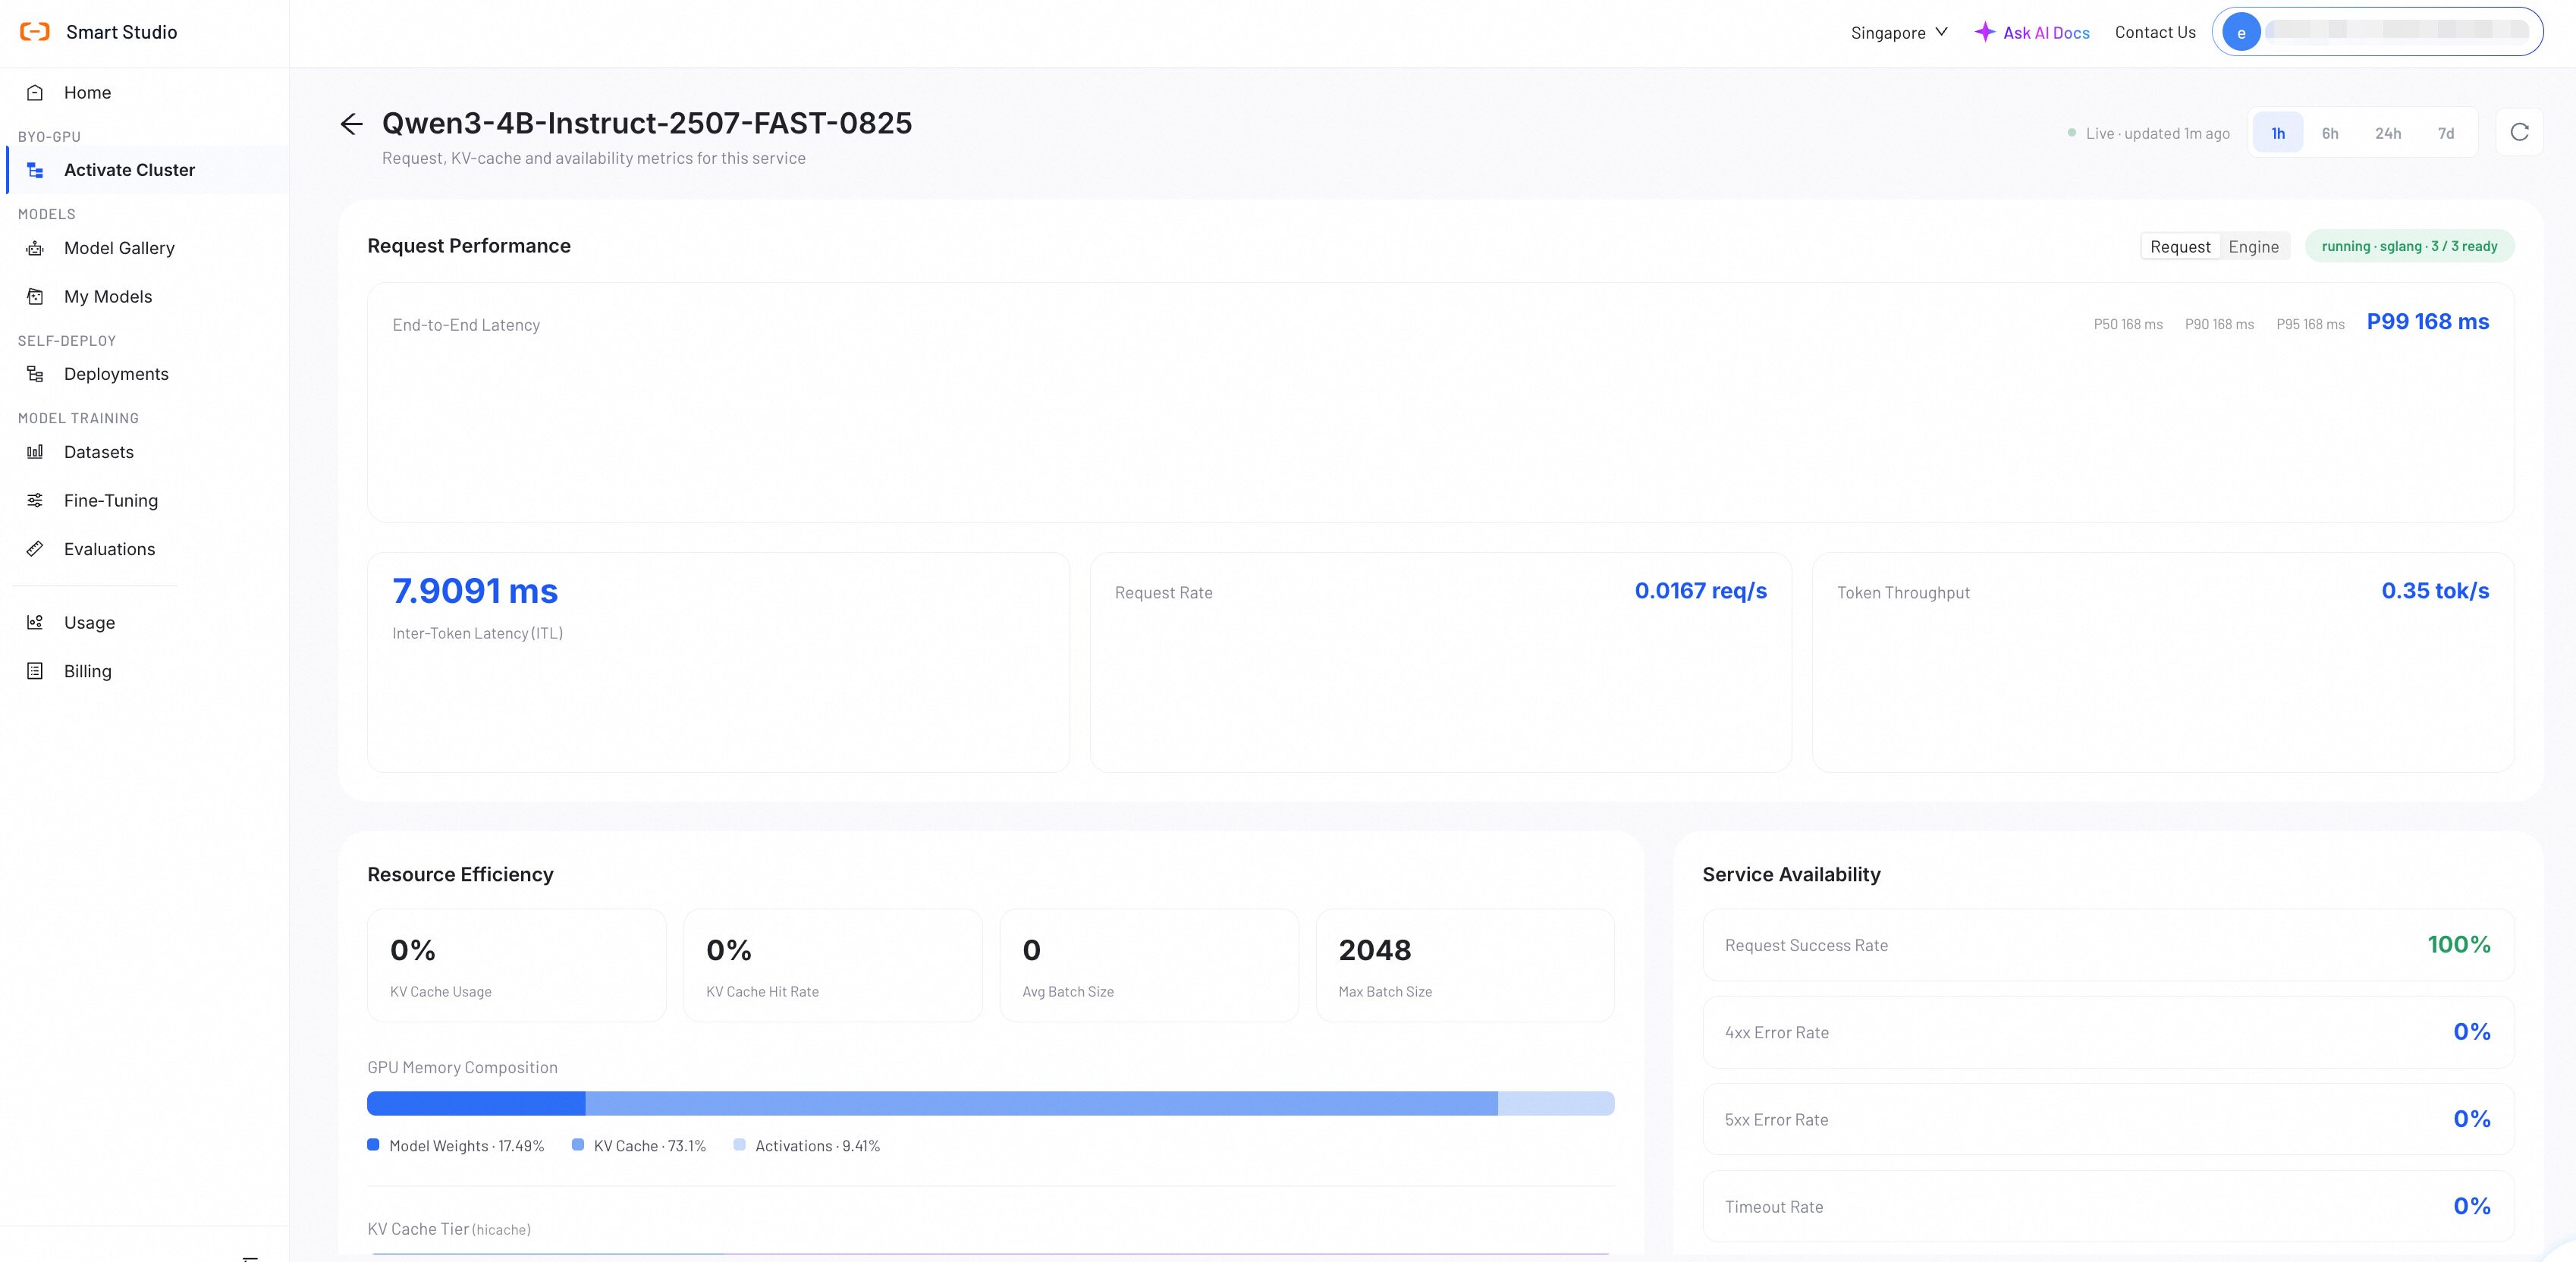
Some engine-level metrics require the serving engine to expose metrics. An empty engine panel does not necessarily mean the service is unavailable; check the service status and request metrics together.
Verify the Result
The cluster is ready for model deployment when every expected node appears, the reported GPU capacity matches the activation plan, and no required node shows a connection or health problem. When a deployment is already running, confirm that its service also appears under Model Serving.
Troubleshooting
GPU Observability is not available
Confirm the activation status is Activated. For Activating records, select Manage and complete the remaining step.
A panel cannot load
Refresh the page. Dashboard panels load independently, so one unavailable metric source does not invalidate the remaining cluster data.
Capacity is lower than expected
Open the Node List and compare every configured server. Then return to Activate Cluster to review the machine configuration and connection status.
Next Steps
After you confirm cluster capacity and health:
- Choose a platform model in Model Gallery.
- Upload a custom model in My Models.
- If a model is already available, create a deployment.