Token usage
Monitor API usage across all keys and models.
Overview
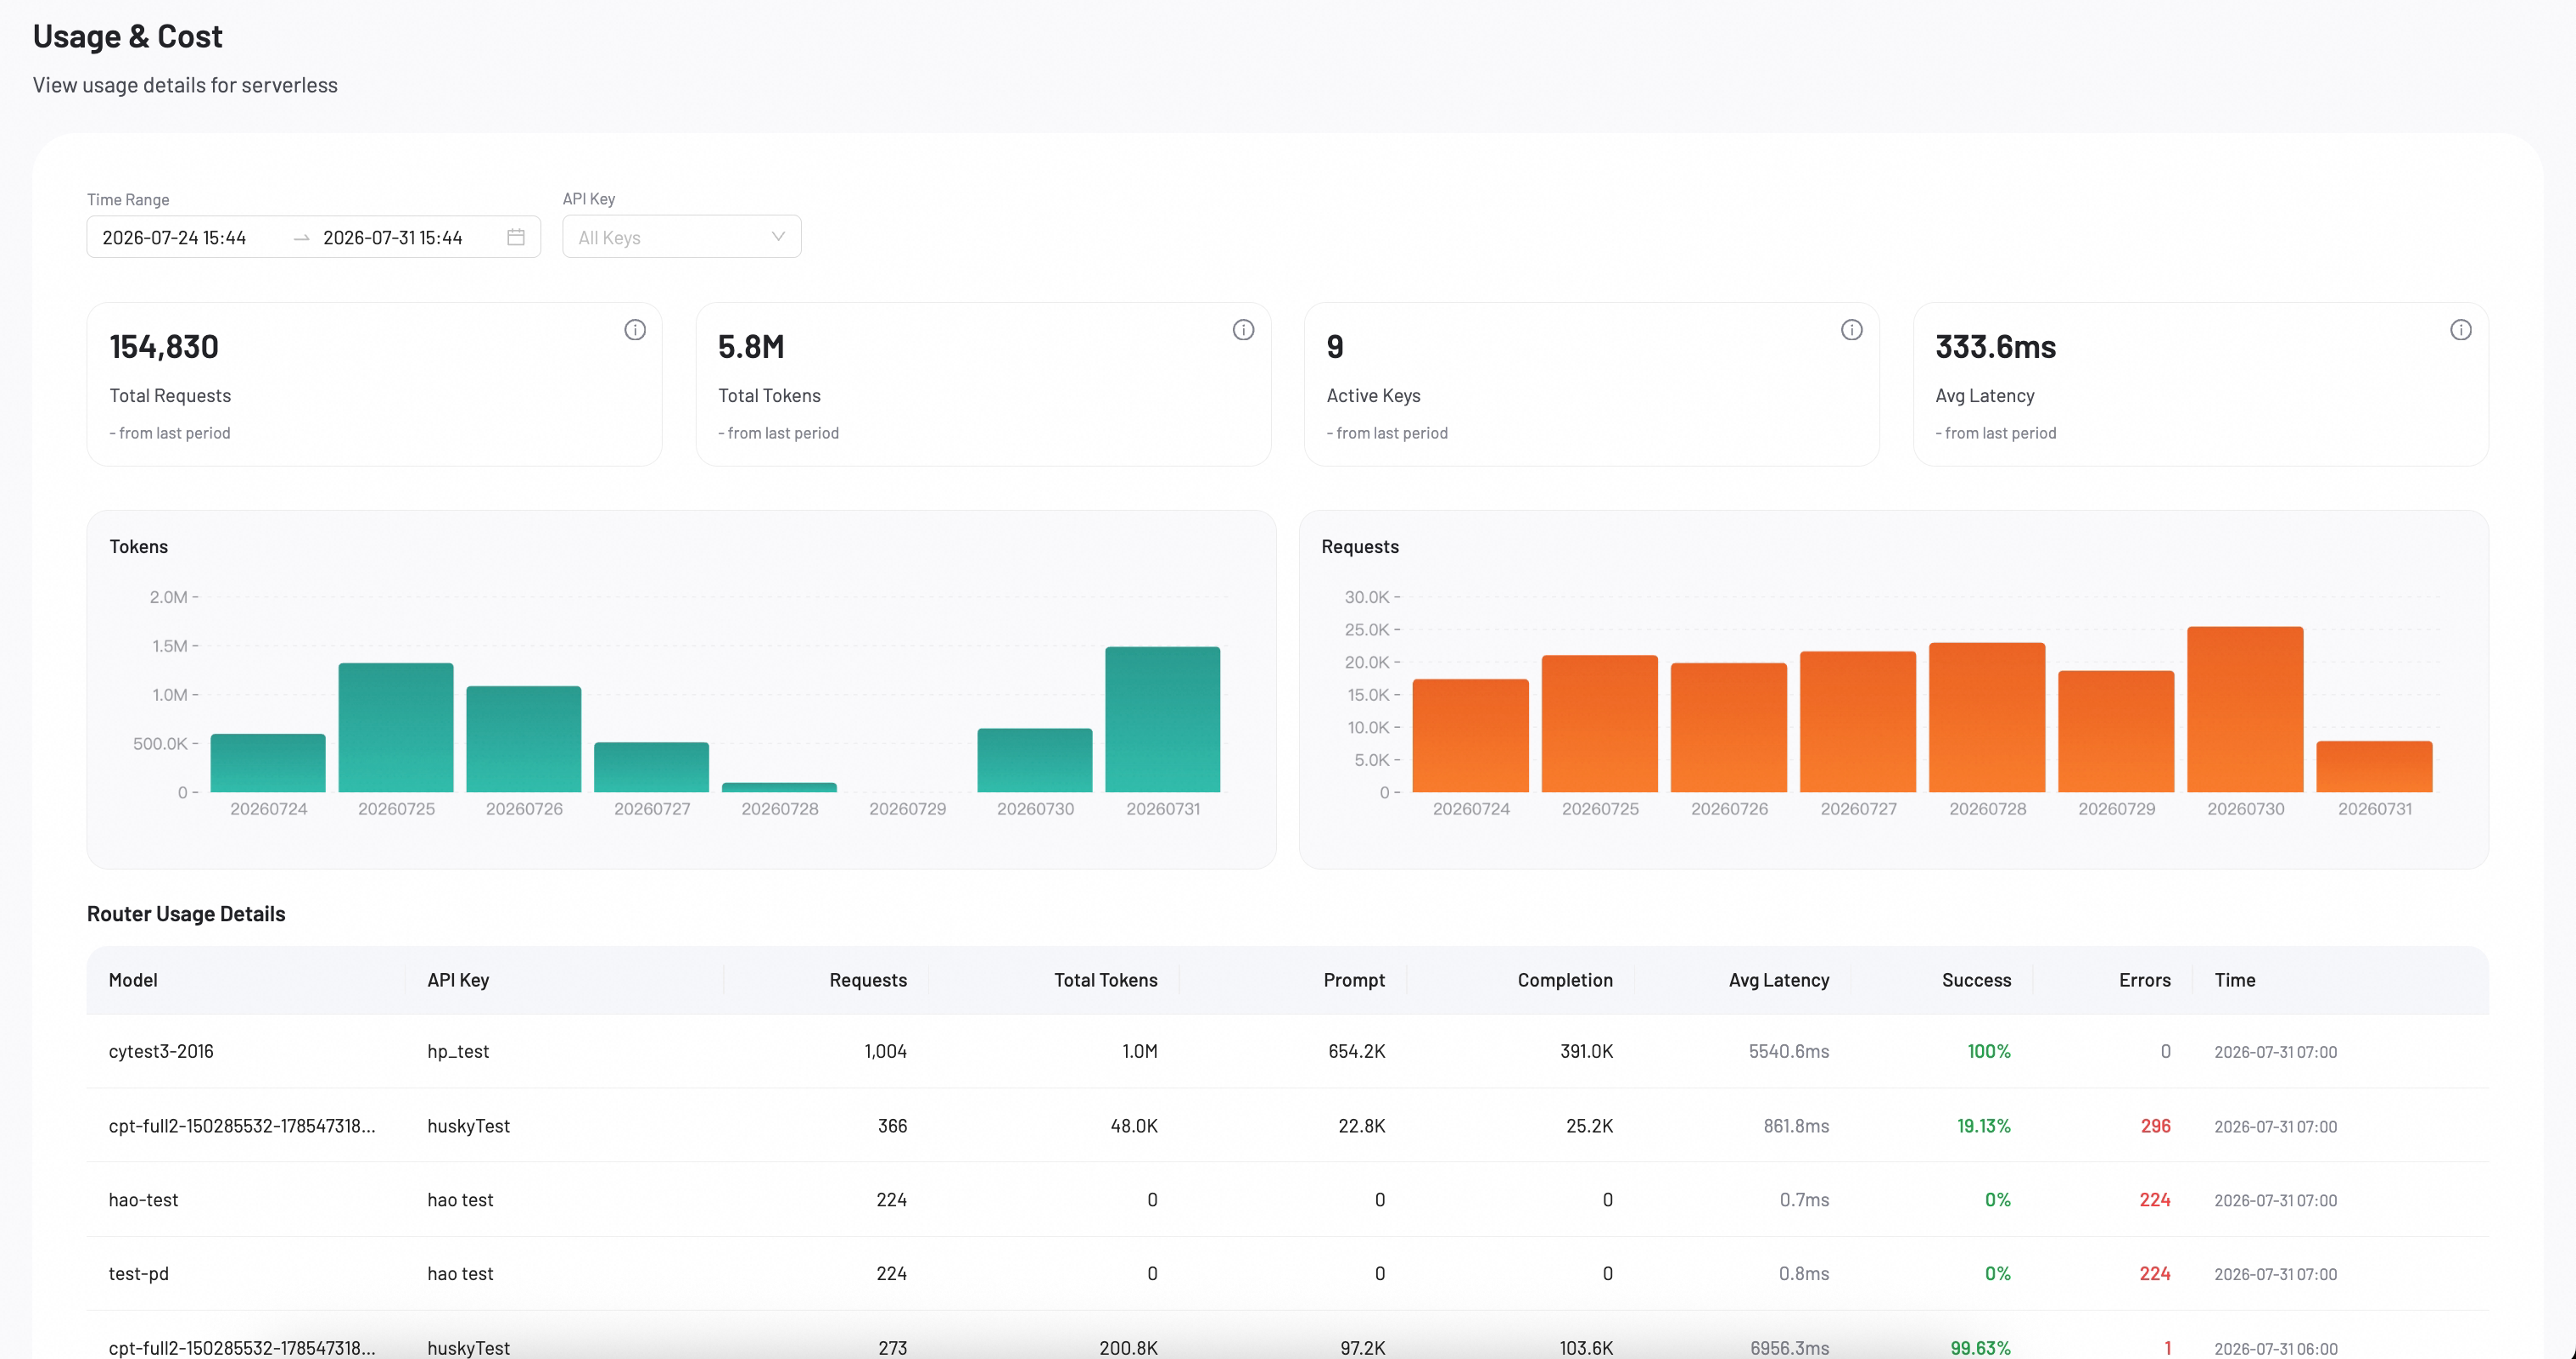
The Token Usage page displays four summary metrics, two trend charts, and a detailed usage table. Use the filters at the top to narrow results by time range or API key.
Summary cards
Four cards display key metrics for the selected time range. Each card compares values against the previous period.
| Card | Description |
|---|---|
| Total Requests | Total number of API requests. |
| Total Tokens | Total tokens consumed (input + output). |
| Active Keys | Number of API keys with activity in the selected period. |
| Avg Latency | Average response latency in milliseconds. |
Usage details
The table lists per-row usage records with the following columns:
| Column | Description |
|---|---|
| Model | The model used. |
| API Key | The API key used for the request. |
| Requests | Number of requests. |
| Total Tokens | Total tokens consumed. |
| Prompt | Input tokens in the prompt. |
| Completion | Output tokens in the response. |
| Avg Latency | Average response latency. |
| Success | Success rate percentage. |
| Errors | Number of failed requests. |
| Time | Time window of the record. |
The table supports pagination. Choose 10, 20, or 50 rows per page.