Observability
The Observability page provides multi-layer monitoring across services, nodes, and clusters. Use this page to track real-time resource utilization, view historical trends, and inspect the performance of individual nodes and model serving instances.
Observability overview
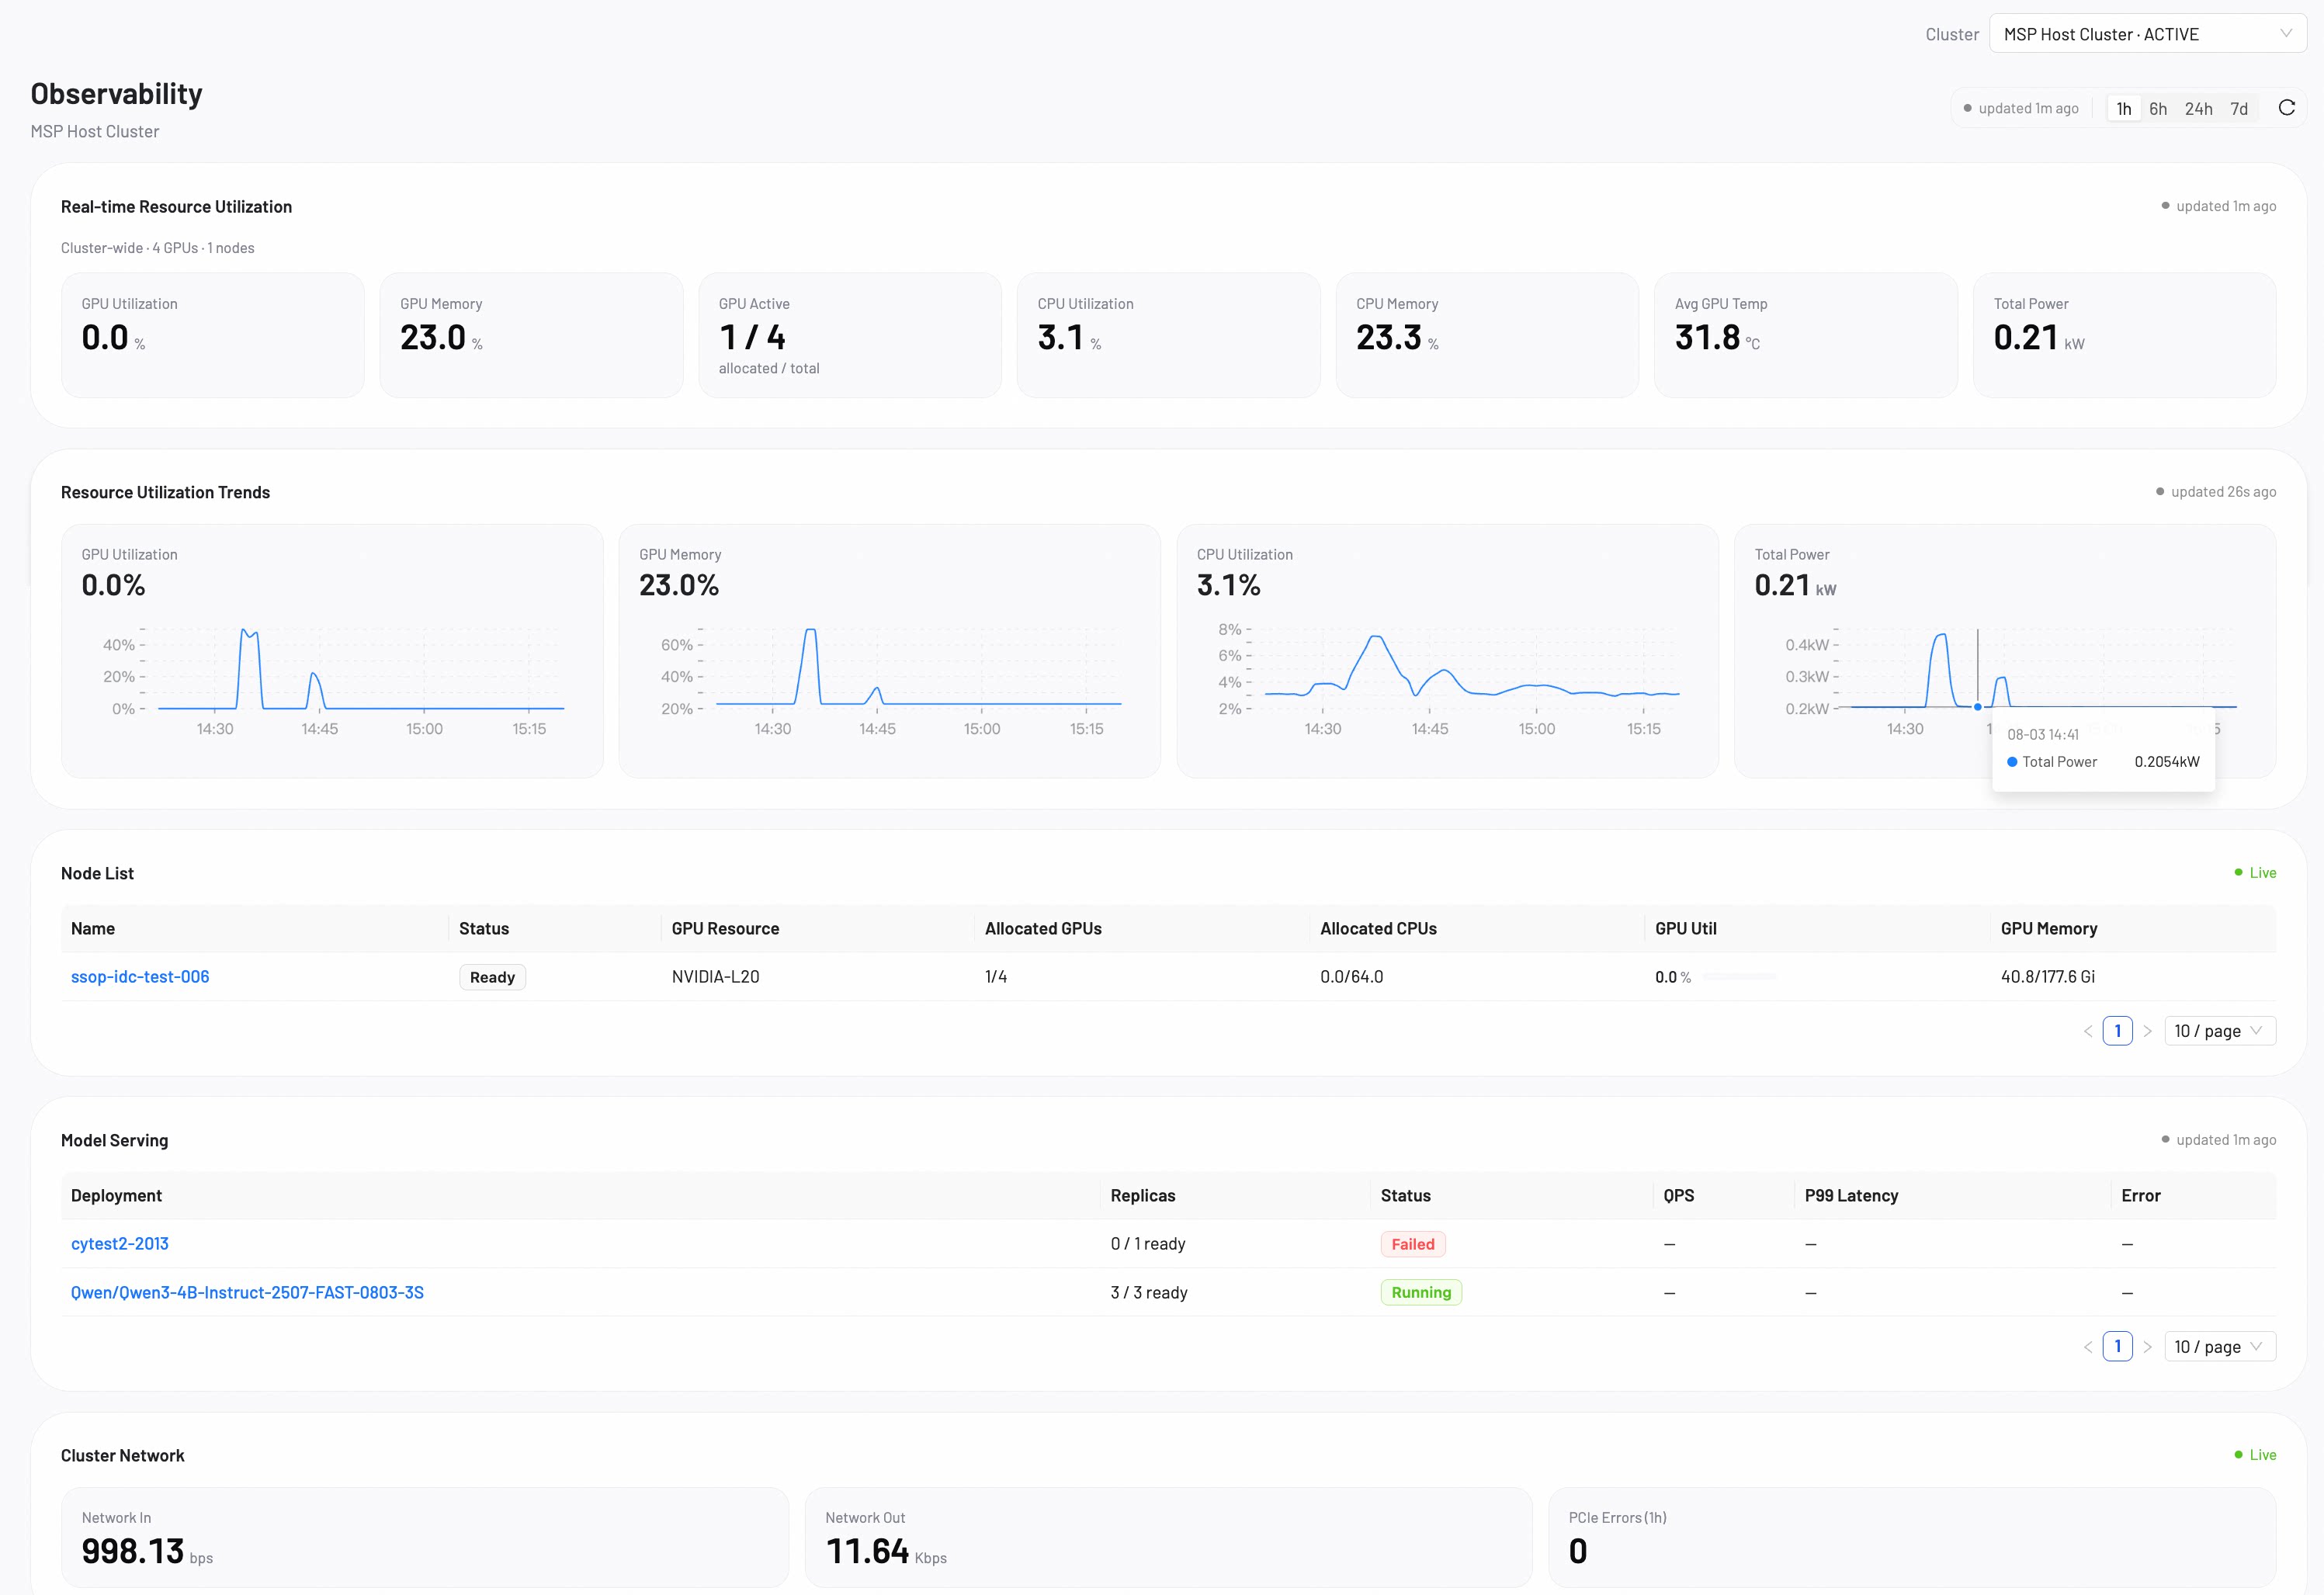
The observability overview page consolidates key monitoring information into a single view:
- Real-time Resource Utilization: Current GPU, GPU memory, CPU, and CPU memory utilization for the selected cluster. Metrics update automatically to reflect the live state of cluster resources.
- Resource Utilization Trends: Historical time-series charts for the same four metrics. Use the time range selector to view data over 1h, 24h, or 7d periods. Each chart displays the current value at the latest data point and supports hover tooltips for detailed readings.
- Node List: Summary table of all nodes in the cluster, including status, GPU resource allocation, and utilization. Select a node to open the node detail page for in-depth inspection.
- Model Serving: Table of all running model services with real-time performance metrics such as GPU utilization, TTFT, latency, throughput, and QPS. Select a model service to view its real-time performance.
- Cluster Network: Internal and external API server endpoints for the cluster, useful for verifying network accessibility.
Node detail
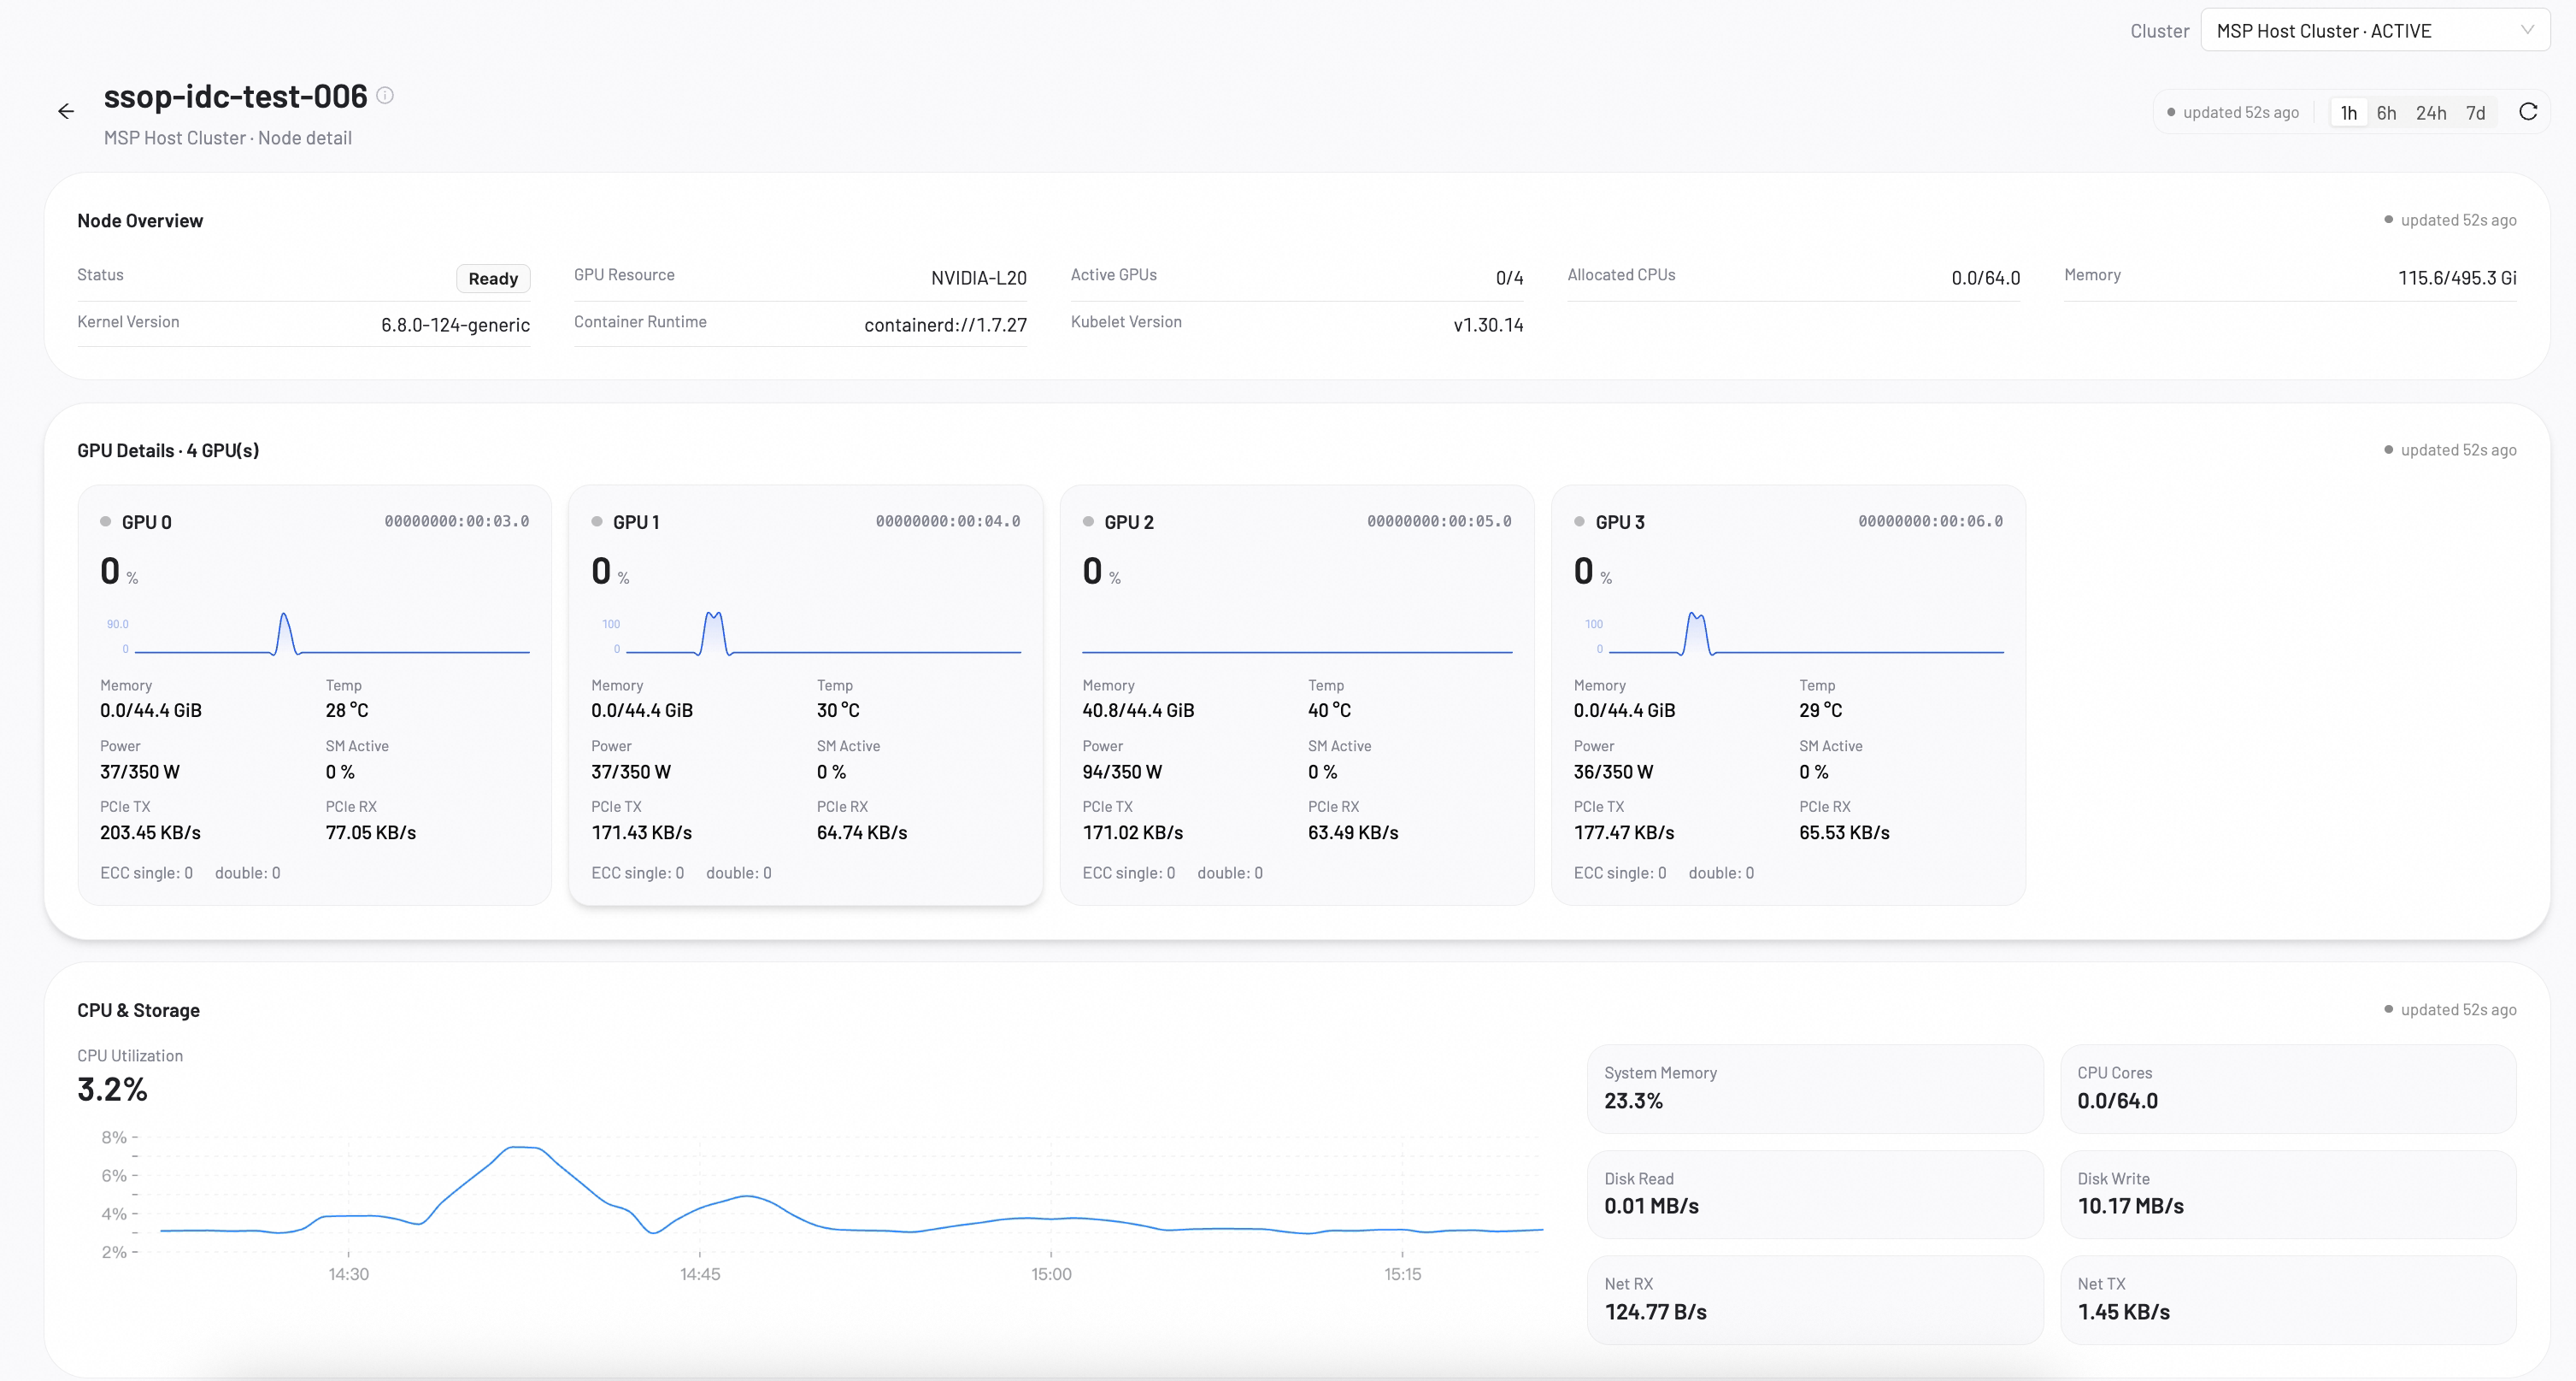
Click a node name from the node list to open the node detail page. The page displays real-time metrics organized into three sections:
GPU details
Displays a card for each GPU on the node, showing utilization with a sparkline chart, memory usage, temperature, power draw, and other metrics:
- SM Active: Percentage of streaming multiprocessors actively processing workloads. A value of 0% indicates the GPU is idle.
- PCIe TX / RX: Bandwidth of data transferred between the GPU and host over the PCIe bus. TX is transmit (GPU to host), RX is receive (host to GPU). Abnormal values may indicate data transfer bottlenecks.
- ECC: Error-correcting code memory error counts. Single-bit errors are automatically corrected; double-bit errors are uncorrectable and require attention.
CPU & storage
Displays CPU utilization with a time-series chart, along with system memory, CPU cores, disk I/O, and network throughput metrics:
- Net RX / TX: Network receive and transmit throughput. RX is incoming traffic, TX is outgoing traffic.
Model serving detail
Click a service name from the model serving table to open the service detail page. The page provides in-depth monitoring organized into three sections:
Performance
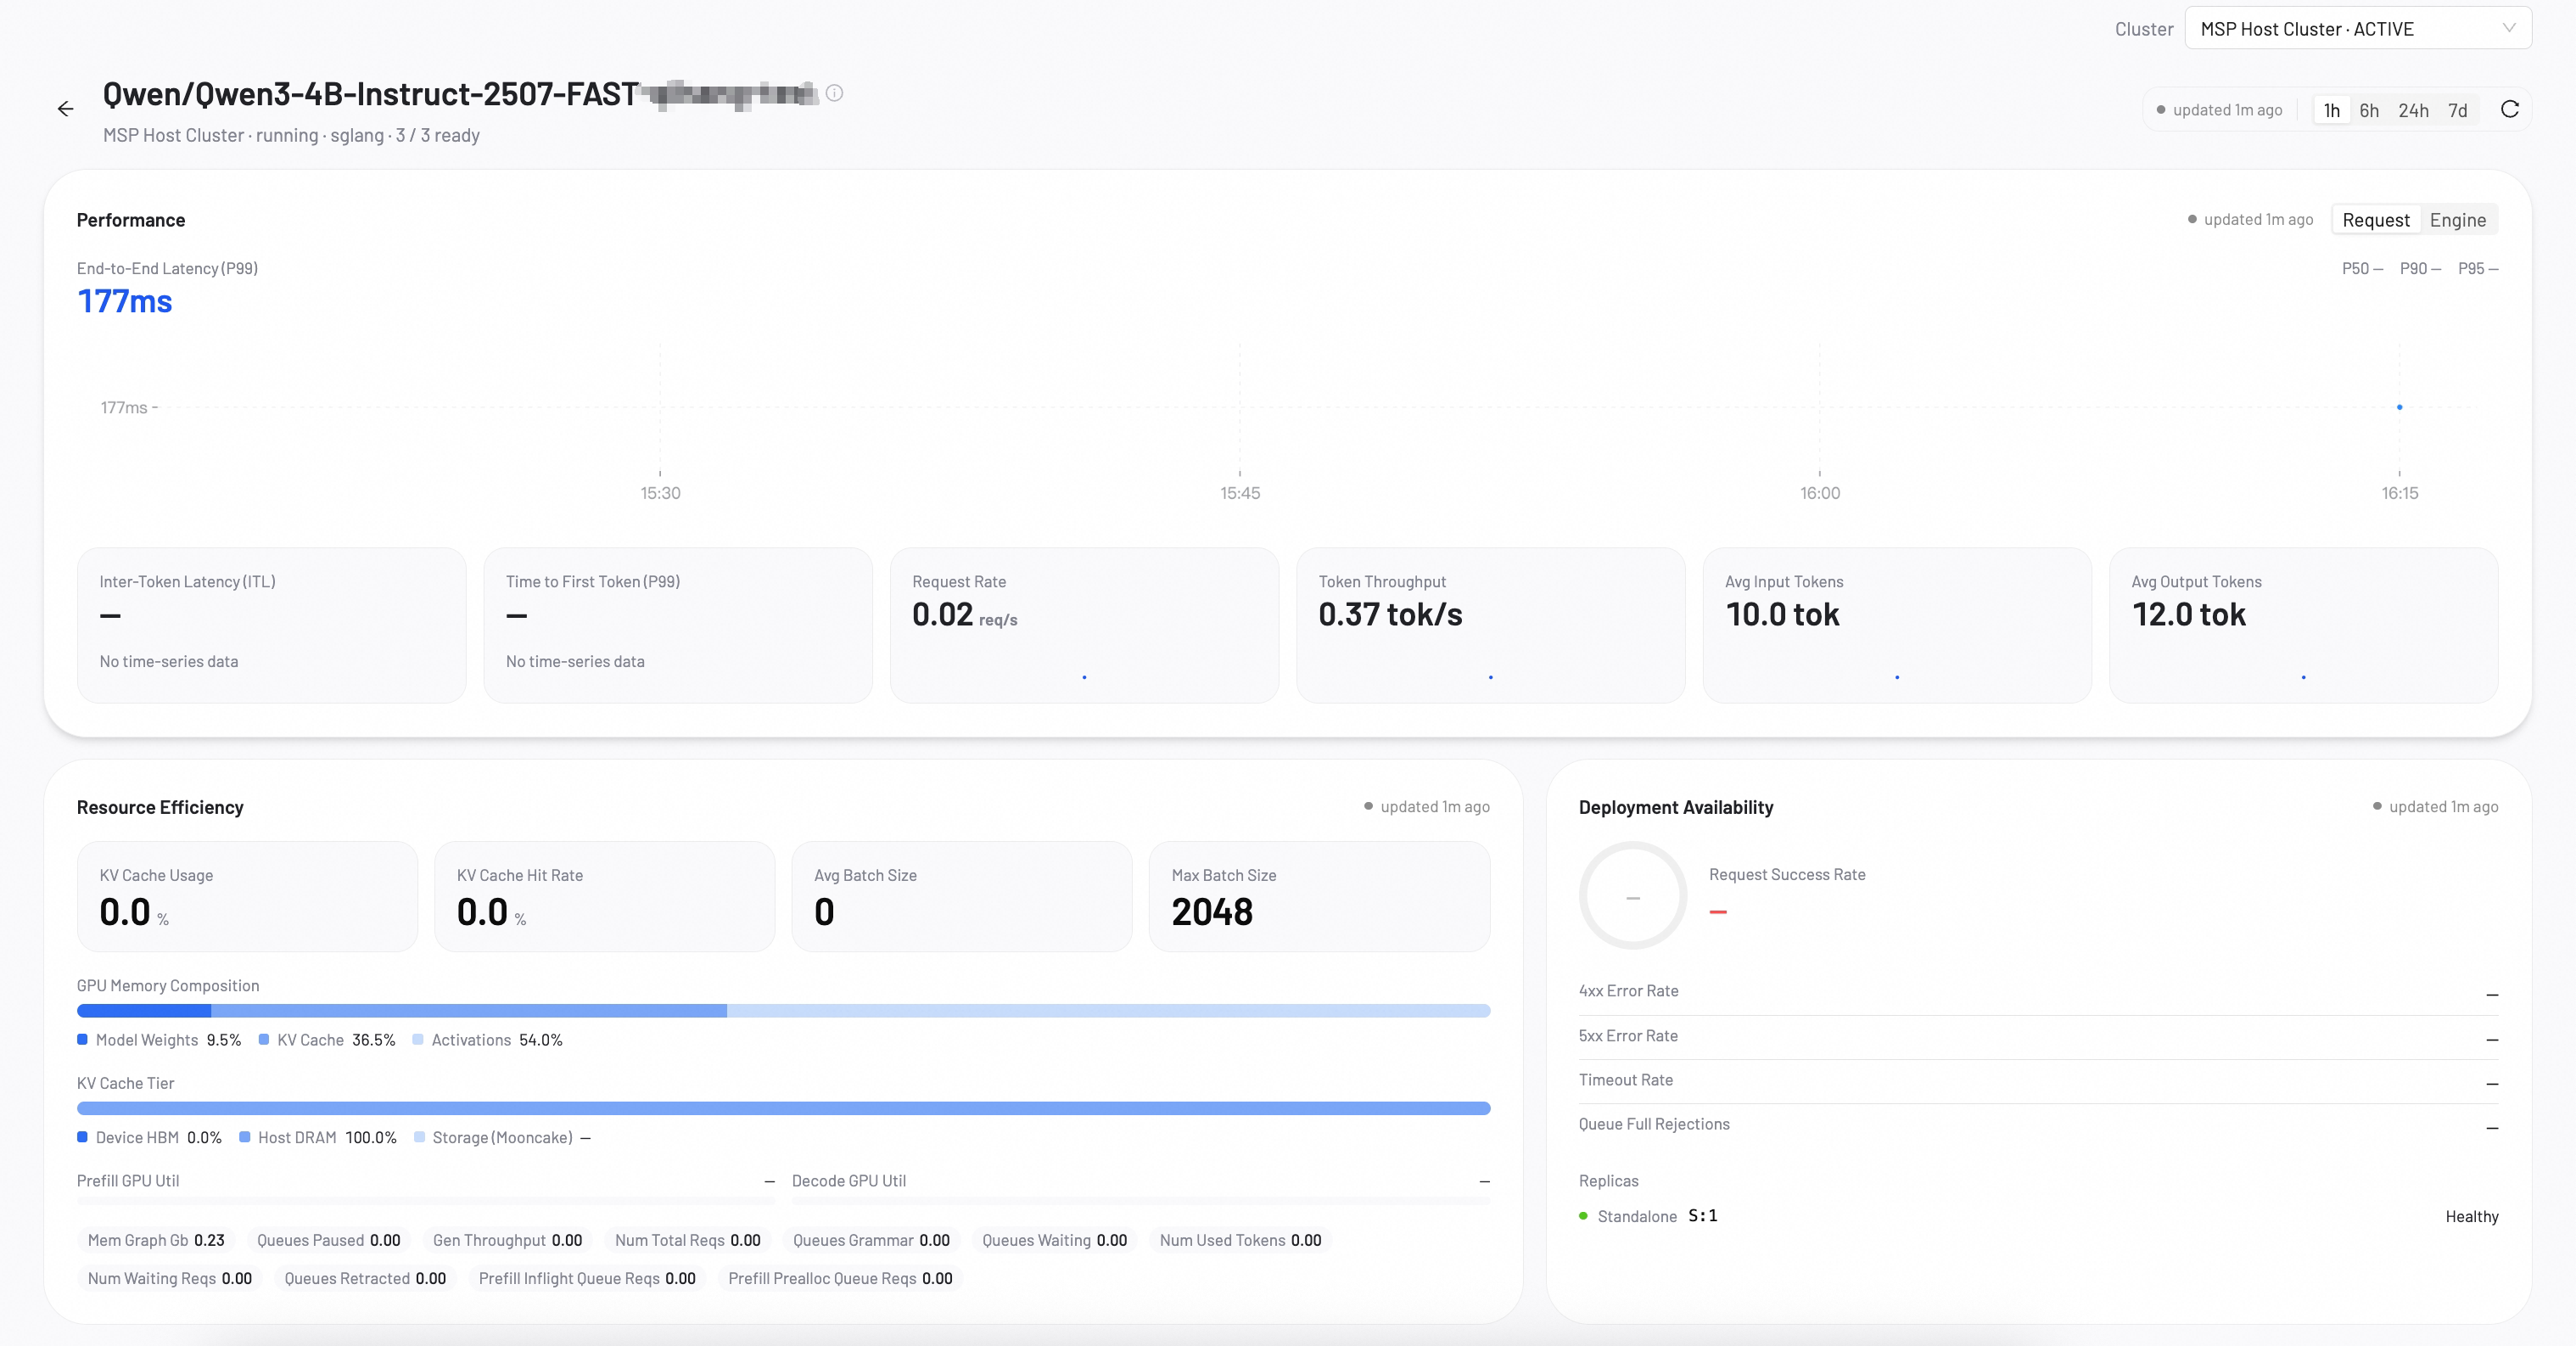
Displays end-to-end latency with a time-series chart and key latency metrics. Use the percentile selector (P50, P90, P95) to view different latency percentiles. P99 represents the 99th percentile value, meaning 99% of requests complete within this time — it better reflects tail latency than averages.
Key metrics include:
- ITL: Inter-Token Latency — the time interval between consecutive output tokens. Lower values indicate smoother generation.
- TTFT: Time to First Token — the time from when a request is sent to when the first token is received. Directly affects perceived response speed.
- Request Rate: Number of requests processed per second, reflecting real-time service load.
- Token Throughput: Total tokens (input + output) processed per second, measuring overall throughput capacity.
- Avg Input / Output Tokens: Average input prompt length and output response length in tokens.
Resource efficiency
Displays resource utilization metrics and memory composition for the service:
- KV Cache Usage: Percentage of KV Cache memory currently in use relative to total KV Cache capacity.
- KV Cache Hit Rate: Percentage of requests that reuse cached KV pairs. A high hit rate indicates repeated requests that can reuse previous computation results, reducing inference cost.
- Avg / Max Batch Size: Average and maximum number of requests processed together in a single batch. Larger batch sizes increase throughput but may also increase latency.
- GPU Memory Composition: Breakdown of GPU memory usage into three categories: Model Weights (model parameters), KV Cache (cached key-value pairs), and Activations (intermediate computation values).
- KV Cache Tier: Distribution of KV Cache across storage tiers: Device HBM (GPU memory, fastest), Host DRAM (system memory), and Storage/Mooncake (external storage, largest capacity but slowest).
- Prefill / Decode GPU Util: GPU utilization during the Prefill phase (processing input prompts) and Decode phase (generating output tokens token by token).
Deployment availability
Displays service reliability metrics:
- Request Success Rate: Percentage of requests that completed successfully.
- 4xx / 5xx Error Rate: Percentage of requests that returned client errors (4xx) or server errors (5xx).
- Timeout Rate: Percentage of requests that exceeded the timeout threshold.
- Queue Full Rejections: Number of requests rejected because the request queue was full.
- Replicas: Number of deployment replicas and their health status.